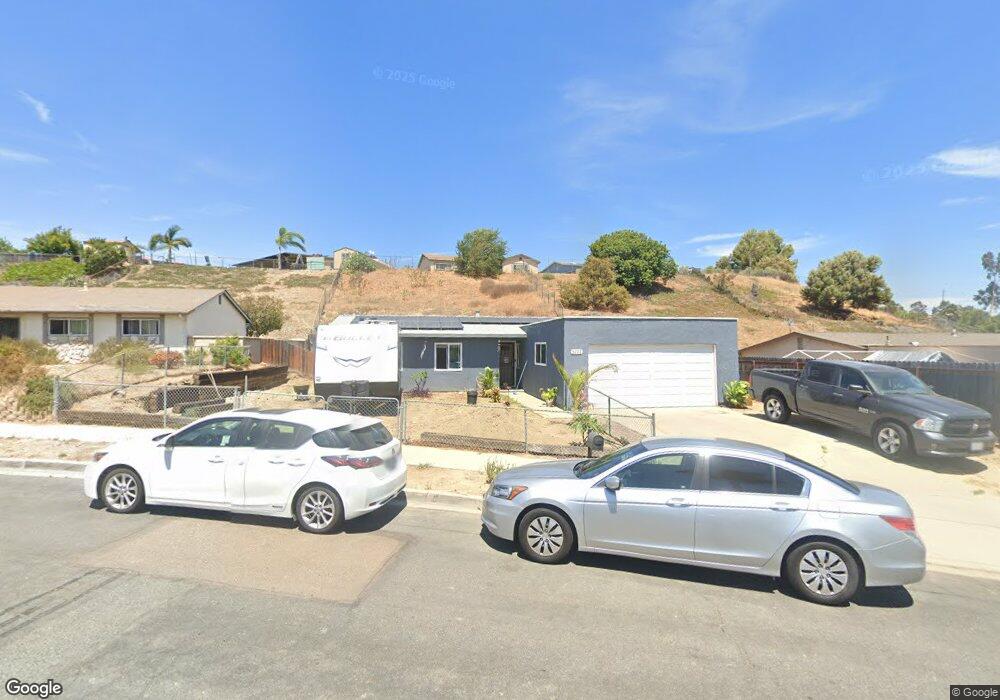
5222 Leon St Oceanside, CA 92057
North Valley NeighborhoodEstimated Value: $692,000 - $807,366
4
Beds
2
Baths
1,352
Sq Ft
$554/Sq Ft
Est. Value
About This Home
This home is located at 5222 Leon St, Oceanside, CA 92057 and is currently estimated at $749,342, approximately $554 per square foot. 5222 Leon St is a home located in San Diego County with nearby schools including Del Rio Elementary School, Cesar Chavez Middle School, and El Camino High School.
Ownership History
Date
Name
Owned For
Owner Type
Purchase Details
Closed on
Oct 28, 2019
Sold by
B Tan Investments Llc
Bought by
Alford Heather and Alford Ski P
Current Estimated Value
Home Financials for this Owner
Home Financials are based on the most recent Mortgage that was taken out on this home.
Original Mortgage
$399,640
Outstanding Balance
$351,580
Interest Rate
3.6%
Mortgage Type
New Conventional
Estimated Equity
$397,762
Purchase Details
Closed on
Feb 7, 2019
Sold by
Hake Richard A
Bought by
B Tan Investments Llc
Home Financials for this Owner
Home Financials are based on the most recent Mortgage that was taken out on this home.
Original Mortgage
$425,000
Interest Rate
4.4%
Mortgage Type
Seller Take Back
Purchase Details
Closed on
Oct 31, 2018
Sold by
Hake Richard A
Bought by
Hake Richard A and The 5222 Leon Trust Dated June 14 2018
Home Financials for this Owner
Home Financials are based on the most recent Mortgage that was taken out on this home.
Original Mortgage
$275,000
Interest Rate
4.6%
Mortgage Type
New Conventional
Purchase Details
Closed on
Oct 29, 2018
Sold by
Enl Investments Llc
Bought by
Enl Investments Llc
Home Financials for this Owner
Home Financials are based on the most recent Mortgage that was taken out on this home.
Original Mortgage
$275,000
Interest Rate
4.6%
Mortgage Type
New Conventional
Purchase Details
Closed on
Jun 25, 2018
Sold by
Xavier Patricia
Bought by
Make Richard A and 5222 Leon Trust
Purchase Details
Closed on
Mar 3, 2013
Sold by
Grindstaff David S and Grindstaff Rebeca
Bought by
Enl Investments and 5222 Leon Street Trust
Purchase Details
Closed on
Feb 5, 2009
Sold by
Re Ventures Renovation Ca Llc
Bought by
Grindstaff David S and Grindstaff Rebeca
Home Financials for this Owner
Home Financials are based on the most recent Mortgage that was taken out on this home.
Original Mortgage
$240,052
Interest Rate
4.91%
Mortgage Type
VA
Purchase Details
Closed on
Oct 24, 2008
Sold by
Act Properties Llc
Bought by
Re Ventures Renovation Ca Llc
Purchase Details
Closed on
Feb 5, 2008
Sold by
Murray Serena and Murray Teresa
Bought by
Act Properties Llc
Purchase Details
Closed on
Jan 3, 2007
Sold by
Murray Ernest M and Murray Teresa E
Bought by
Murray Teresa E and Murray Serena
Home Financials for this Owner
Home Financials are based on the most recent Mortgage that was taken out on this home.
Original Mortgage
$437,000
Interest Rate
6.29%
Mortgage Type
New Conventional
Create a Home Valuation Report for This Property
The Home Valuation Report is an in-depth analysis detailing your home's value as well as a comparison with similar homes in the area
Home Values in the Area
Average Home Value in this Area
Purchase History
| Date | Buyer | Sale Price | Title Company |
|---|---|---|---|
| Alford Heather | $412,000 | Amrock | |
| B Tan Investments Llc | $425,000 | First American Title Company | |
| Hake Richard A | -- | None Available | |
| Enl Investments Llc | -- | None Available | |
| Make Richard A | $400,000 | First American Title Insuran | |
| Enl Investments | $232,000 | None Available | |
| Grindstaff David S | $235,000 | Fidelity National Title Co | |
| Re Ventures Renovation Ca Llc | $135,000 | Lsi Title Company Ca | |
| Act Properties Llc | $240,975 | Landsafe Title | |
| Murray Teresa E | -- | Lenders Choice Title |
Source: Public Records
Mortgage History
| Date | Status | Borrower | Loan Amount |
|---|---|---|---|
| Open | Alford Heather | $399,640 | |
| Previous Owner | B Tan Investments Llc | $425,000 | |
| Previous Owner | Hake Richard A | $275,000 | |
| Previous Owner | Grindstaff David S | $240,052 | |
| Previous Owner | Murray Teresa E | $437,000 | |
| Closed | Enl Investments Llc | $0 |
Source: Public Records
Tax History
| Year | Tax Paid | Tax Assessment Tax Assessment Total Assessment is a certain percentage of the fair market value that is determined by local assessors to be the total taxable value of land and additions on the property. | Land | Improvement |
|---|---|---|---|---|
| 2025 | $4,912 | $450,579 | $328,093 | $122,486 |
| 2024 | $4,912 | $441,745 | $321,660 | $120,085 |
| 2023 | $4,759 | $433,084 | $315,353 | $117,731 |
| 2022 | $4,686 | $424,593 | $309,170 | $115,423 |
| 2021 | $4,703 | $416,268 | $303,108 | $113,160 |
| 2020 | $4,635 | $412,000 | $300,000 | $112,000 |
| 2019 | $4,458 | $400,000 | $300,000 | $100,000 |
| 2018 | $2,829 | $249,947 | $161,604 | $88,343 |
| 2017 | $2,777 | $245,047 | $158,436 | $86,611 |
| 2016 | $2,687 | $240,243 | $155,330 | $84,913 |
| 2015 | $2,609 | $236,635 | $152,997 | $83,638 |
| 2014 | $2,510 | $232,000 | $150,000 | $82,000 |
Source: Public Records
Map
Nearby Homes
- 5133 Greenbrook St
- 663 Charles Dr
- 1311 Bellingham Dr
- 868 Panella Ct
- 273 Stallion Dr
- 1268 Bellingham Dr
- 656 Parker St
- 924 Glendora Dr
- 671 Parker St
- 150 N River Cir Unit 105
- 5033 Los Morros Way Unit 55
- 5034 Los Morros Way Unit 62
- 569 Gold Dr
- 5015 Macario Dr
- 5108 Andrew Jackson St
- 149 Mellano Way
- 161 Mellano Way
- 5065 Waterview Way Unit 101
- 5065 Waterview Way
- 5063 Waterview Way Unit 101
Your Personal Tour Guide
Ask me questions while you tour the home.