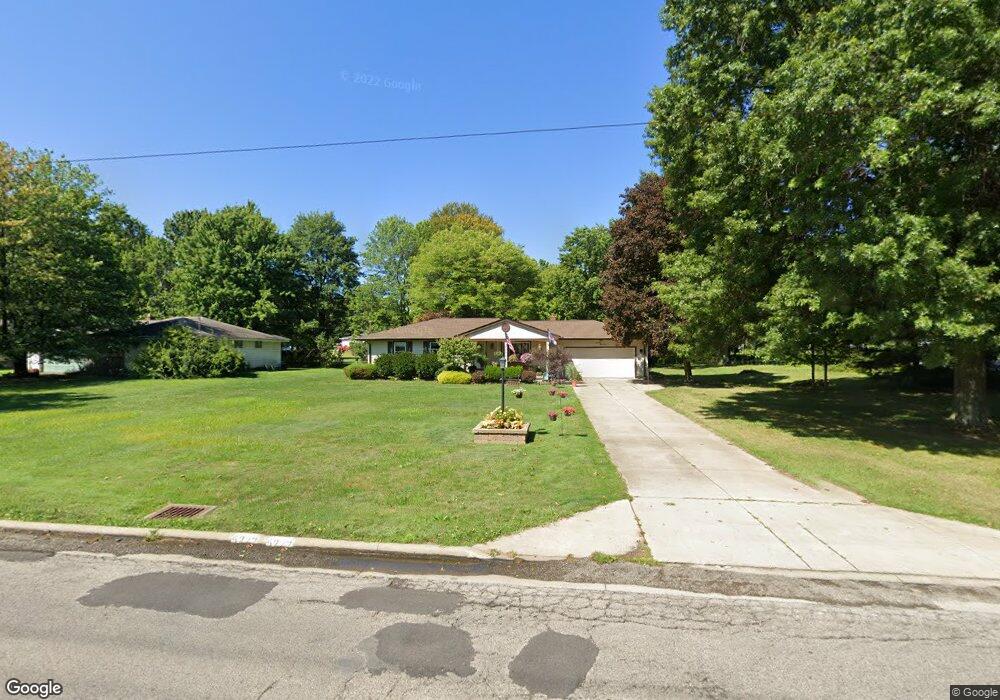
5222 Sheridan Rd Youngstown, OH 44514
Estimated Value: $145,000 - $171,000
3
Beds
2
Baths
1,092
Sq Ft
$147/Sq Ft
Est. Value
About This Home
This home is located at 5222 Sheridan Rd, Youngstown, OH 44514 and is currently estimated at $160,781, approximately $147 per square foot. 5222 Sheridan Rd is a home located in Mahoning County with nearby schools including Paul C. Bunn Elementary School, Clear Horizons Early College High School, and Chaney High School.
Ownership History
Date
Name
Owned For
Owner Type
Purchase Details
Closed on
Aug 28, 2018
Sold by
Tofil Suzette A and Estate M Markovich
Bought by
Barber Phillip D and Barber Rhonda K
Current Estimated Value
Home Financials for this Owner
Home Financials are based on the most recent Mortgage that was taken out on this home.
Original Mortgage
$72,250
Outstanding Balance
$62,876
Interest Rate
4.5%
Mortgage Type
New Conventional
Estimated Equity
$97,905
Purchase Details
Closed on
Dec 7, 2010
Sold by
Markovich Rosemary E
Bought by
Markovich Gary M
Home Financials for this Owner
Home Financials are based on the most recent Mortgage that was taken out on this home.
Original Mortgage
$68,000
Interest Rate
4.19%
Mortgage Type
New Conventional
Purchase Details
Closed on
Mar 6, 1987
Bought by
Markovich Rosemary E
Create a Home Valuation Report for This Property
The Home Valuation Report is an in-depth analysis detailing your home's value as well as a comparison with similar homes in the area
Home Values in the Area
Average Home Value in this Area
Purchase History
| Date | Buyer | Sale Price | Title Company |
|---|---|---|---|
| Barber Phillip D | $85,000 | None Available | |
| Markovich Gary M | $85,000 | Attorney | |
| Markovich Rosemary E | -- | -- |
Source: Public Records
Mortgage History
| Date | Status | Borrower | Loan Amount |
|---|---|---|---|
| Open | Barber Phillip D | $72,250 | |
| Previous Owner | Markovich Gary M | $68,000 |
Source: Public Records
Tax History Compared to Growth
Tax History
| Year | Tax Paid | Tax Assessment Tax Assessment Total Assessment is a certain percentage of the fair market value that is determined by local assessors to be the total taxable value of land and additions on the property. | Land | Improvement |
|---|---|---|---|---|
| 2024 | $1,781 | $41,400 | $7,580 | $33,820 |
| 2023 | $2,306 | $41,400 | $7,580 | $33,820 |
| 2022 | $2,118 | $28,720 | $6,900 | $21,820 |
| 2021 | $2,118 | $28,720 | $6,900 | $21,820 |
| 2020 | $2,128 | $28,720 | $6,900 | $21,820 |
| 2019 | $2,092 | $24,750 | $5,940 | $18,810 |
| 2018 | $1,988 | $24,750 | $5,940 | $18,810 |
| 2017 | $1,985 | $24,750 | $5,940 | $18,810 |
| 2016 | $2,052 | $27,190 | $7,270 | $19,920 |
| 2015 | $2,015 | $27,190 | $7,270 | $19,920 |
| 2014 | $2,003 | $27,190 | $7,270 | $19,920 |
| 2013 | $1,978 | $27,190 | $7,270 | $19,920 |
Source: Public Records
Map
Nearby Homes
- 1828 Basil Ave
- 1933 Brandon Ave
- 1830 Halbert Dr
- 1919 Wingate Rd
- 0 Lemoyne Ave
- 1720 Sequoya Dr
- 1913 Country Club Ave
- 1841 Wingate Rd
- 0 Woodlawn Ave
- 0 Oles Ave
- 1543 Lynn Ave
- 1514 Thalia Ave
- 1890 Mathews Rd
- 5710 Youngstown Poland Rd
- 576 W Harvey St
- 550 Brandon Ave
- 2089 Shetland Ln
- 0 Mathews Rd Unit 5149232
- 0 Mathews Rd Unit 5143059
- 1894 Lealand Ave
- 5230 Sheridan Rd
- 1811 Brandon Ave
- 1807 Brandon Ave
- 5234 Sheridan Rd
- 1805 Brandon Ave
- 1803 Brandon Ave
- 5100 Sheridan Rd
- 5313 Linger Place
- 5238 Sheridan Rd
- 1876 Basil Ave
- 5209 Sheridan Rd
- 5205 Sheridan Rd
- 1806 Brandon Ave
- 5221 Sheridan Rd
- 1801 Brandon Ave
- 5317 Linger Place
- 1870 Basil Ave
- 5178 Sheridan Rd
- 5231 Sheridan Rd
- 5306 Sheridan Rd