Estimated Value: $511,000 - $584,000
4
Beds
3
Baths
3,912
Sq Ft
$139/Sq Ft
Est. Value
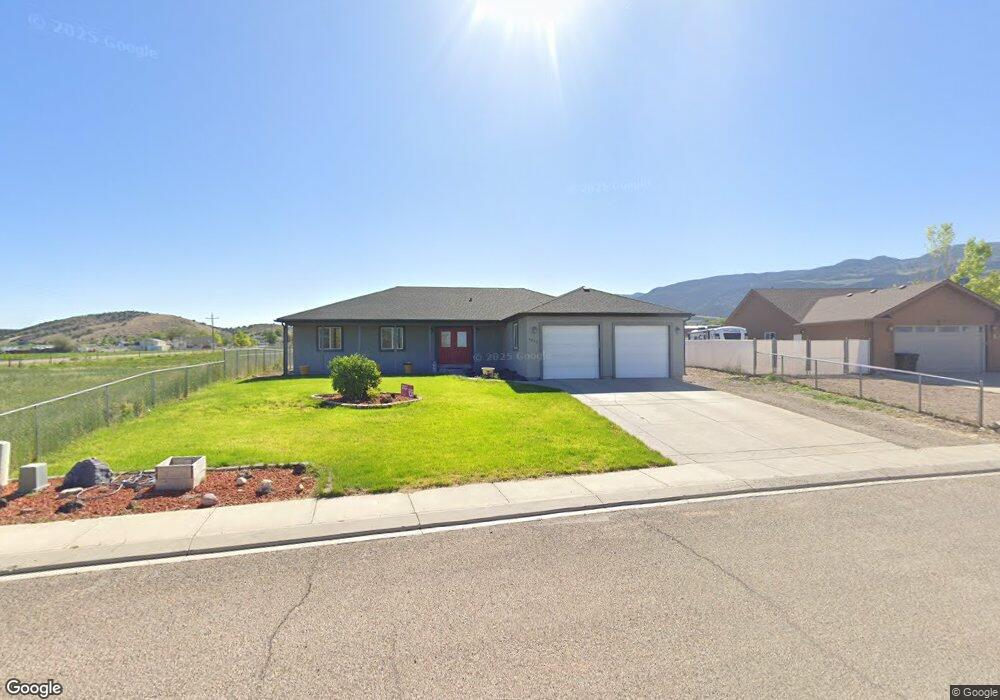
About This Home
This home is located at 5222 Tomahawk Dr, Enoch, UT 84721 and is currently estimated at $544,667, approximately $139 per square foot. 5222 Tomahawk Dr is a home located in Iron County with nearby schools including Enoch School, Cedar Middle School, and Cedar City High School.
Ownership History
Date
Name
Owned For
Owner Type
Purchase Details
Closed on
Oct 28, 2022
Sold by
Zollinger Rhett
Bought by
Henke Trent S and Henke Candace
Current Estimated Value
Home Financials for this Owner
Home Financials are based on the most recent Mortgage that was taken out on this home.
Original Mortgage
$426,400
Outstanding Balance
$410,766
Interest Rate
6.02%
Mortgage Type
New Conventional
Estimated Equity
$133,901
Purchase Details
Closed on
Jun 13, 2008
Sold by
Isom Scott
Bought by
Day Denim and Day Traci
Home Financials for this Owner
Home Financials are based on the most recent Mortgage that was taken out on this home.
Original Mortgage
$228,375
Interest Rate
5.99%
Mortgage Type
FHA
Purchase Details
Closed on
Jun 12, 2007
Sold by
Hansen Thomas O and Hansen Trudy A
Bought by
Isom Scott
Create a Home Valuation Report for This Property
The Home Valuation Report is an in-depth analysis detailing your home's value as well as a comparison with similar homes in the area
Home Values in the Area
Average Home Value in this Area
Purchase History
| Date | Buyer | Sale Price | Title Company |
|---|---|---|---|
| Henke Trent S | -- | Inwest Title | |
| Day Denim | -- | -- | |
| Isom Scott | -- | -- |
Source: Public Records
Mortgage History
| Date | Status | Borrower | Loan Amount |
|---|---|---|---|
| Open | Henke Trent S | $426,400 | |
| Previous Owner | Day Denim | $228,375 |
Source: Public Records
Tax History
| Year | Tax Paid | Tax Assessment Tax Assessment Total Assessment is a certain percentage of the fair market value that is determined by local assessors to be the total taxable value of land and additions on the property. | Land | Improvement |
|---|---|---|---|---|
| 2025 | $2,067 | $283,121 | $45,650 | $237,471 |
| 2023 | $2,073 | $280,280 | $42,160 | $238,120 |
| 2022 | $2,195 | $256,630 | $40,155 | $216,475 |
| 2021 | $1,693 | $197,950 | $17,535 | $180,415 |
| 2020 | $1,765 | $181,285 | $17,535 | $163,750 |
| 2019 | $1,688 | $164,605 | $15,745 | $148,860 |
| 2018 | $1,687 | $159,890 | $15,745 | $144,145 |
| 2017 | $1,539 | $153,040 | $15,745 | $137,295 |
| 2016 | $1,246 | $115,355 | $11,230 | $104,125 |
| 2015 | $1,235 | $108,065 | $0 | $0 |
| 2014 | $1,212 | $99,690 | $0 | $0 |
Source: Public Records
Map
Nearby Homes
- 1860 E 5250 N
- 1822 E 5250 N
- 1799 E 5250 N
- 1356 E 5200 N
- 1814 E 5100 N
- 1206 Eden Way
- 5613 N Enoch Rd
- Lot 54 Valley Gate Estates
- 5217 N Juniper Ridge Rd
- 4785 Old Scout Trail
- 5154 N Juniper Ridge Rd
- 5154 N Juniper Ridge Rd
- 0 Spring Hill Phase 2 W Water Unit approx 1875 E 5275 N
- 0 Spring Hill Phase 2 W Water Unit 25-265474
- 2318 W 5190 N
- 5165 N 2570 W
- 4766 N Mule Train Dr
- 5 Acre Ft 1963 Priority Date
- 3 acre ft
- 60 acre ft Priority Date 1951
- 5222 Tomahawk Dr
- 5202 Tomahawk Dr
- 5202 Tomahawk Dr
- 5239 N 1425 E
- 5239 Tomahawk Dr
- 5178 Tomahawk Dr
- 5203 Tomahawk Dr
- 5177 N Tomahawk Dr
- 5177 Tomahawk Dr
- 5177 N 1425 E;;;5177 Tomahawk N
- 1445 E Highland Trails Rd
- 1459 E Highland Trails Rd
- 5145 Tomahawk Dr
- 5145 Tomahawk Dr
- 1860 E 5250 N Unit 1
- 1848 E 5250 N Unit 1
- 1829 E 5250 N Unit 1
- 1822 E 5250 N Unit 1
- 1799 E 5250 N Unit 1
- 1792 E 5250 N Unit 1
Your Personal Tour Guide
Ask me questions while you tour the home.