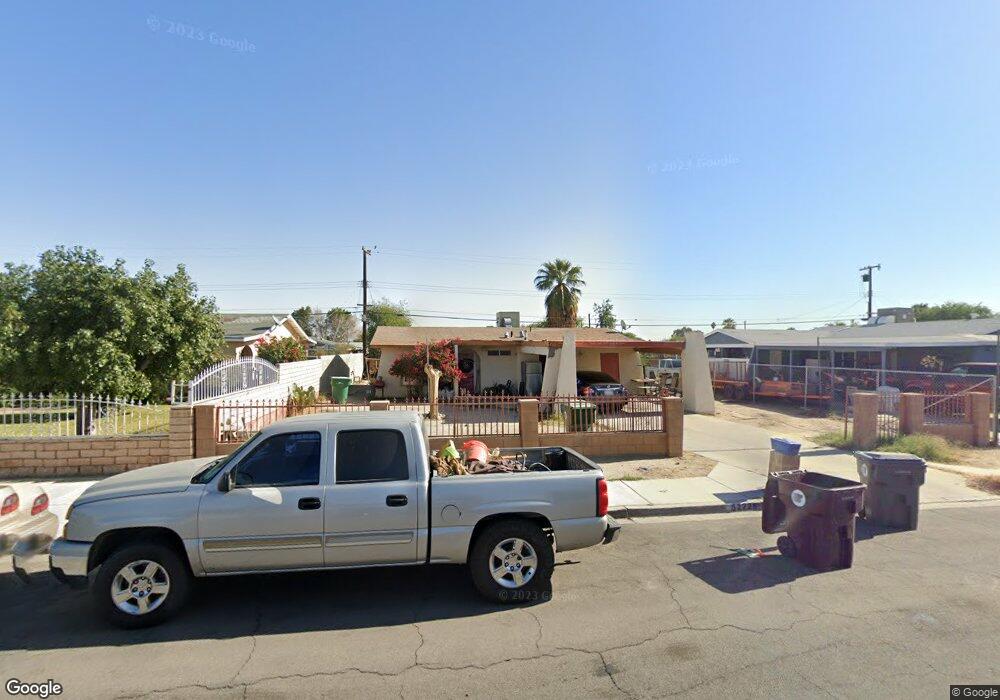
52228 Jennifer Way Coachella, CA 92236
Estimated Value: $238,000 - $377,000
3
Beds
2
Baths
1,160
Sq Ft
$276/Sq Ft
Est. Value
About This Home
This home is located at 52228 Jennifer Way, Coachella, CA 92236 and is currently estimated at $319,654, approximately $275 per square foot. 52228 Jennifer Way is a home located in Riverside County with nearby schools including Valley View Elementary School, Bobby Duke Middle School, and Coachella Valley High School.
Ownership History
Date
Name
Owned For
Owner Type
Purchase Details
Closed on
Feb 11, 2009
Sold by
Deutsche Bank National Trust Company
Bought by
Garcia Genaro and Garcia Petra
Current Estimated Value
Purchase Details
Closed on
Jun 18, 2008
Sold by
Cruz Jose B and Cruz Maria L
Bought by
Deutsche Bank National Trust Co and Morgan Stanley Abs Capital I Inc Trust 2
Purchase Details
Closed on
Jan 7, 2000
Sold by
Cruz Jose B
Bought by
Cruz Jose B and Cruz Maria L
Home Financials for this Owner
Home Financials are based on the most recent Mortgage that was taken out on this home.
Original Mortgage
$120,000
Interest Rate
6.5%
Mortgage Type
New Conventional
Purchase Details
Closed on
Jul 14, 1998
Sold by
Cruz Maria M
Bought by
Cruz Jose B
Home Financials for this Owner
Home Financials are based on the most recent Mortgage that was taken out on this home.
Original Mortgage
$54,944
Interest Rate
7.01%
Create a Home Valuation Report for This Property
The Home Valuation Report is an in-depth analysis detailing your home's value as well as a comparison with similar homes in the area
Home Values in the Area
Average Home Value in this Area
Purchase History
| Date | Buyer | Sale Price | Title Company |
|---|---|---|---|
| Garcia Genaro | $46,000 | Landsafe Title San Bernardin | |
| Deutsche Bank National Trust Co | $110,500 | Landsafe Title | |
| Cruz Jose B | -- | Chicago Title Co | |
| Cruz Jose B | -- | Benefit Land Title |
Source: Public Records
Mortgage History
| Date | Status | Borrower | Loan Amount |
|---|---|---|---|
| Previous Owner | Cruz Jose B | $120,000 | |
| Previous Owner | Cruz Jose B | $54,944 |
Source: Public Records
Tax History Compared to Growth
Tax History
| Year | Tax Paid | Tax Assessment Tax Assessment Total Assessment is a certain percentage of the fair market value that is determined by local assessors to be the total taxable value of land and additions on the property. | Land | Improvement |
|---|---|---|---|---|
| 2025 | $1,802 | $59,216 | $33,472 | $25,744 |
| 2023 | $1,802 | $56,919 | $32,173 | $24,746 |
| 2022 | $1,715 | $55,804 | $31,543 | $24,261 |
| 2021 | $1,680 | $54,711 | $30,925 | $23,786 |
| 2020 | $1,604 | $54,151 | $30,608 | $23,543 |
| 2019 | $1,550 | $53,090 | $30,008 | $23,082 |
| 2018 | $1,508 | $52,050 | $29,419 | $22,631 |
| 2017 | $1,452 | $51,031 | $28,843 | $22,188 |
| 2016 | $1,401 | $50,031 | $28,278 | $21,753 |
| 2015 | $1,365 | $49,281 | $27,854 | $21,427 |
| 2014 | $859 | $48,317 | $27,309 | $21,008 |
Source: Public Records
Map
Nearby Homes
- 53175 Cesar Chavez St
- 53049 Cesar Chavez St
- 0 Damascus Ave
- 52717 Calle Techa
- 52066 Channing Ct
- 53079 Cesar Chavez St
- 83904 52nd Ave
- 0 52nd Ave Unit 219131177DA
- 0 Palm Ave
- 51812 Sunset Dr
- 50529 Grapefruit Blvd
- 53020 Torino Place
- 52313 Calle Alicia
- 1449 3rd St
- 85675 Michelle Dr
- 84461 Vermouth Dr
- 1423 2nd St
- 85158 Avenida Tacuba
- 50442 S Kenmore St
- 437 Vine Ave
- 52246 Jennifer Way
- 52210 Jennifer Way
- 52229 Tripoli Way
- 52247 Tripoli Way
- 52211 Tripoli Way
- 52264 Jennifer Way
- 52192 Jennifer Way
- 52265 Tripoli Way
- 52229 Jennifer Way
- 52191 Tripoli Way
- 52211 Jennifer Way
- 52247 Jennifer Way
- 52282 Jennifer Way
- 52174 Jennifer Way
- 52191 Jennifer Way
- 52265 Jennifer Way
- 52283 Tripoli Way
- 52173 Tripoli Way
- 52173 Jennifer Way
- 52300 Jennifer Way