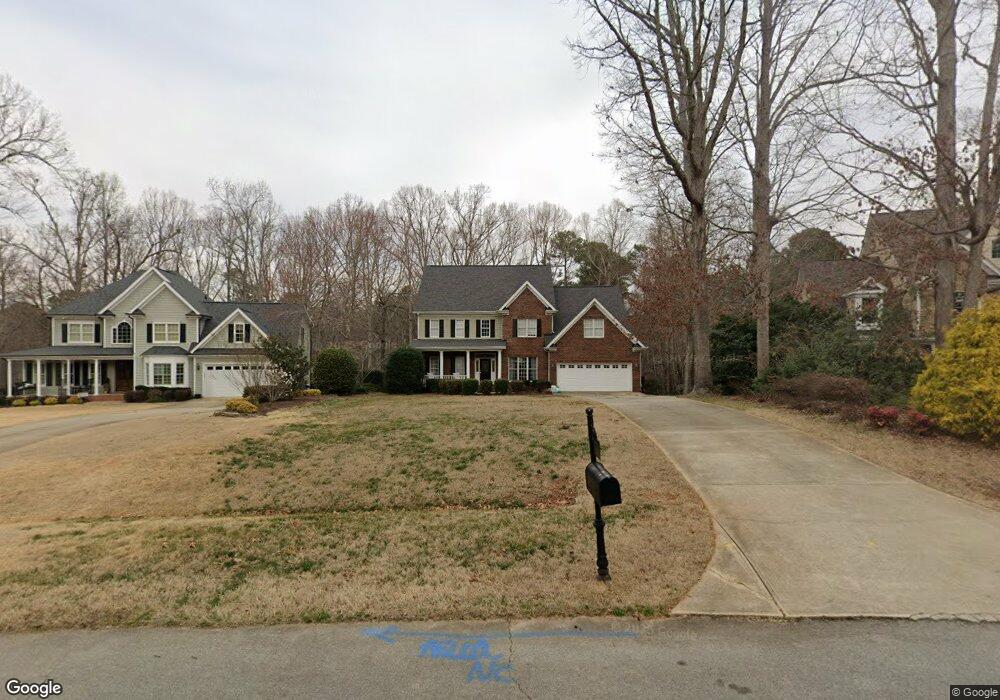
5224 Levering Mill Rd Apex, NC 27539
Middle Creek NeighborhoodEstimated Value: $802,000 - $954,000
3
Beds
3
Baths
3,050
Sq Ft
$292/Sq Ft
Est. Value
About This Home
This home is located at 5224 Levering Mill Rd, Apex, NC 27539 and is currently estimated at $891,245, approximately $292 per square foot. 5224 Levering Mill Rd is a home located in Wake County with nearby schools including Lufkin Road Middle School, Apex High School, and Pine Springs Prep Academy.
Ownership History
Date
Name
Owned For
Owner Type
Purchase Details
Closed on
Mar 29, 2011
Sold by
Suntrust Bank
Bought by
Pozder Vladimir and Pozder Juli W
Current Estimated Value
Home Financials for this Owner
Home Financials are based on the most recent Mortgage that was taken out on this home.
Original Mortgage
$259,600
Outstanding Balance
$180,351
Interest Rate
4.95%
Mortgage Type
New Conventional
Estimated Equity
$710,894
Purchase Details
Closed on
Feb 2, 2011
Sold by
Lee Kevin and Lee Deamyungju
Bought by
Sun Trust Bank
Home Financials for this Owner
Home Financials are based on the most recent Mortgage that was taken out on this home.
Original Mortgage
$259,600
Outstanding Balance
$180,351
Interest Rate
4.95%
Mortgage Type
New Conventional
Estimated Equity
$710,894
Purchase Details
Closed on
Apr 22, 2003
Sold by
Patterson Mcclain Homes Inc
Bought by
Lee Kevin and Lee Deemyungiu
Home Financials for this Owner
Home Financials are based on the most recent Mortgage that was taken out on this home.
Original Mortgage
$246,000
Interest Rate
5.6%
Create a Home Valuation Report for This Property
The Home Valuation Report is an in-depth analysis detailing your home's value as well as a comparison with similar homes in the area
Home Values in the Area
Average Home Value in this Area
Purchase History
| Date | Buyer | Sale Price | Title Company |
|---|---|---|---|
| Pozder Vladimir | $325,000 | Boston National Title Agency | |
| Sun Trust Bank | $303,187 | None Available | |
| Lee Kevin | $346,000 | -- |
Source: Public Records
Mortgage History
| Date | Status | Borrower | Loan Amount |
|---|---|---|---|
| Open | Pozder Vladimir | $259,600 | |
| Previous Owner | Lee Kevin | $246,000 |
Source: Public Records
Tax History Compared to Growth
Tax History
| Year | Tax Paid | Tax Assessment Tax Assessment Total Assessment is a certain percentage of the fair market value that is determined by local assessors to be the total taxable value of land and additions on the property. | Land | Improvement |
|---|---|---|---|---|
| 2025 | $5,035 | $784,087 | $195,000 | $589,087 |
| 2024 | $4,889 | $784,087 | $195,000 | $589,087 |
| 2023 | $4,092 | $522,254 | $90,000 | $432,254 |
| 2022 | $3,792 | $522,254 | $90,000 | $432,254 |
| 2021 | $3,690 | $522,254 | $90,000 | $432,254 |
| 2020 | $3,629 | $522,254 | $90,000 | $432,254 |
| 2019 | $4,084 | $497,605 | $90,000 | $407,605 |
| 2018 | $3,754 | $497,605 | $90,000 | $407,605 |
| 2017 | $3,558 | $497,605 | $90,000 | $407,605 |
| 2016 | $3,486 | $497,605 | $90,000 | $407,605 |
| 2015 | $3,185 | $455,738 | $90,000 | $365,738 |
| 2014 | -- | $455,738 | $90,000 | $365,738 |
Source: Public Records
Map
Nearby Homes
- 2256 Warbler Dr
- 2264 Warbler Dr
- 2209 Warbler Dr
- 2221 Redpoll Dr
- 2213 Redpoll Dr
- 5044 Dezola St
- 2209 Red Admiral Ct
- 2217 Redpoll Dr
- 2214 Redpoll Dr
- 2204 Red Admiral Ct
- 2208 Red Admiral Ct
- 2210 Redpoll Dr
- 2206 Carcillar Dr
- 2204 Carcillar Dr
- 2208 Carcillar Dr
- 7580 Percussion Dr
- 2218 Carcillar Dr
- 2216 Carcillar Dr
- 2214 Carcillar Dr
- 2212 Carcillar Dr
- 5228 Levering Mill Rd
- 5220 Levering Mill Rd
- 5232 Levering Mill Rd
- 5216 Levering Mill Rd
- 5229 Levering Mill Rd
- 5129 Dezola St
- 5236 Levering Mill Rd
- 5217 Levering Mill Rd
- 5208 Levering Mill Rd
- 5213 Levering Mill Rd
- 5240 Levering Mill Rd
- 3316 Drexel Hill Ct
- 5209 Levering Mill Rd
- 5133 Dezola St
- 3312 Drexel Hill Ct
- 5204 Levering Mill Rd
- 5244 Levering Mill Rd
- 3308 Drexel Hill Ct
- 5205 Levering Mill Rd
- 0000 Dezola St