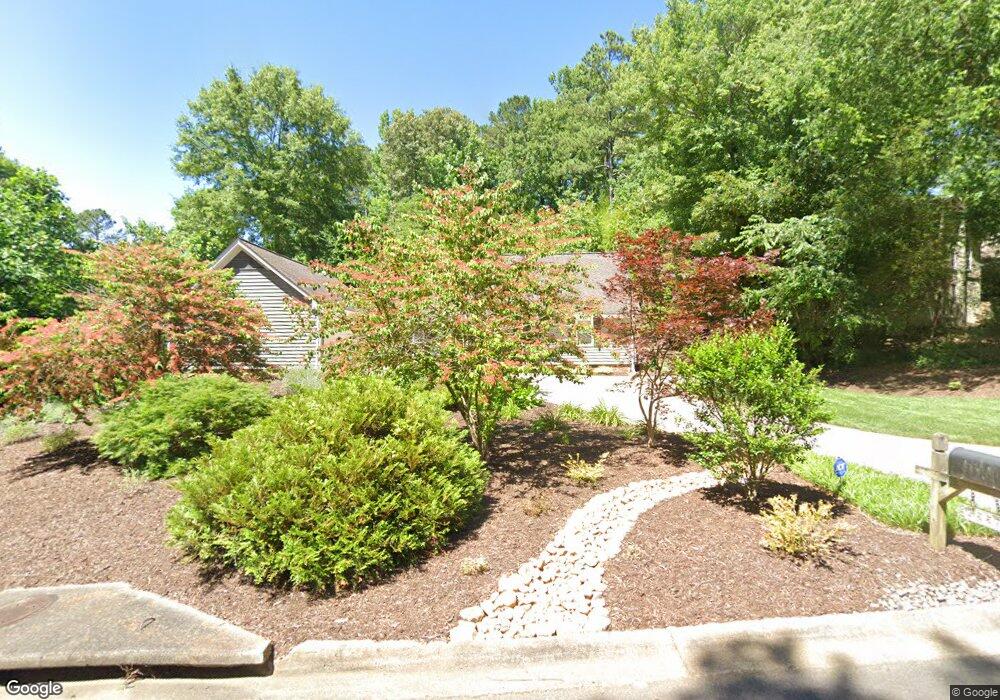
5227 Deering Trail Unit 2 Marietta, GA 30068
East Cobb NeighborhoodEstimated Value: $634,000 - $734,000
4
Beds
3
Baths
2,568
Sq Ft
$258/Sq Ft
Est. Value
About This Home
This home is located at 5227 Deering Trail Unit 2, Marietta, GA 30068 and is currently estimated at $663,349, approximately $258 per square foot. 5227 Deering Trail Unit 2 is a home located in Cobb County with nearby schools including Mount Bethel Elementary School, Dickerson Middle School, and Walton High School.
Ownership History
Date
Name
Owned For
Owner Type
Purchase Details
Closed on
Aug 2, 2024
Sold by
Heaton Michael J and Heaton Susan L
Bought by
Heaton Michael J and Heaton Susan L
Current Estimated Value
Purchase Details
Closed on
Nov 16, 2023
Sold by
Heaton Michael J and Heaton Susan L
Bought by
Brian R R and Brian Susan L
Purchase Details
Closed on
Sep 27, 2002
Sold by
Adams Brian K and Adams Elizabeth B
Bought by
Heaton Michael J and Heaton Susan L
Home Financials for this Owner
Home Financials are based on the most recent Mortgage that was taken out on this home.
Original Mortgage
$192,000
Interest Rate
6.21%
Mortgage Type
New Conventional
Purchase Details
Closed on
Mar 9, 1994
Sold by
Haywood Patsy M
Bought by
Adams Brien K Elizabeth
Home Financials for this Owner
Home Financials are based on the most recent Mortgage that was taken out on this home.
Original Mortgage
$132,200
Interest Rate
7.26%
Create a Home Valuation Report for This Property
The Home Valuation Report is an in-depth analysis detailing your home's value as well as a comparison with similar homes in the area
Home Values in the Area
Average Home Value in this Area
Purchase History
| Date | Buyer | Sale Price | Title Company |
|---|---|---|---|
| Heaton Michael J | -- | None Listed On Document | |
| Brian R R | -- | None Listed On Document | |
| Heaton Michael J | $240,000 | -- | |
| Adams Brien K Elizabeth | $139,200 | -- |
Source: Public Records
Mortgage History
| Date | Status | Borrower | Loan Amount |
|---|---|---|---|
| Previous Owner | Heaton Michael J | $192,000 | |
| Previous Owner | Adams Brien K Elizabeth | $132,200 |
Source: Public Records
Tax History Compared to Growth
Tax History
| Year | Tax Paid | Tax Assessment Tax Assessment Total Assessment is a certain percentage of the fair market value that is determined by local assessors to be the total taxable value of land and additions on the property. | Land | Improvement |
|---|---|---|---|---|
| 2025 | $1,299 | $227,072 | $60,000 | $167,072 |
| 2024 | $1,275 | $217,692 | $50,000 | $167,692 |
| 2023 | $1,006 | $196,552 | $42,000 | $154,552 |
| 2022 | $1,161 | $179,288 | $40,000 | $139,288 |
| 2021 | $1,109 | $162,124 | $36,000 | $126,124 |
| 2020 | $1,075 | $150,572 | $33,200 | $117,372 |
| 2019 | $1,075 | $150,572 | $33,200 | $117,372 |
| 2018 | $1,024 | $133,640 | $29,600 | $104,040 |
| 2017 | $3,249 | $133,640 | $29,600 | $104,040 |
| 2016 | $2,654 | $106,452 | $33,600 | $72,852 |
| 2015 | $2,715 | $106,452 | $33,600 | $72,852 |
| 2014 | $2,735 | $106,452 | $0 | $0 |
Source: Public Records
Map
Nearby Homes
- 5184 Deering Trail Unit 2
- 1382 Huntingford Dr Unit 2
- 1525 Huntingford Dr
- 5157 Forest Brook Pkwy
- 5473 Heyward Square Place
- 1720 Little Willeo Rd
- 1129 Topaz Way
- 1281 Riversound Dr
- 5197 Forest Brook Pkwy
- 889 Waterford Green
- 5122 Sapphire Dr
- 5617 Asheforde Ln
- 1294 Waterford Green Trail
- 5150 Timber Ridge Rd
- 4871 Karls Gate Dr
- 1420 Lafayette Ln
- 5122 Timber Ridge Rd
- 5215 Deering Trail
- 5241 Deering Trail
- 5195 Deering Trail
- 5244 Deering Trail
- 5234 Deering Trail
- 5263 Deering Trail Unit 2
- 5254 Deering Trail Unit 2
- 0 Deering Trail
- 1433 Huntingford Dr Unit 2
- 5185 Deering Trail
- 1443 Huntingford Dr
- 5214 Deering Trail
- 1403 Huntingford Dr Unit 2
- 5194 Deering Trail Unit 26
- 5194 Deering Trail
- 1390 Willow Point Trace Unit 2
- 1453 Huntingford Dr
- 1393 Huntingford Dr Unit 2
- 1391 Willow Point Trace
- 5184 Deering Trail Unit 27