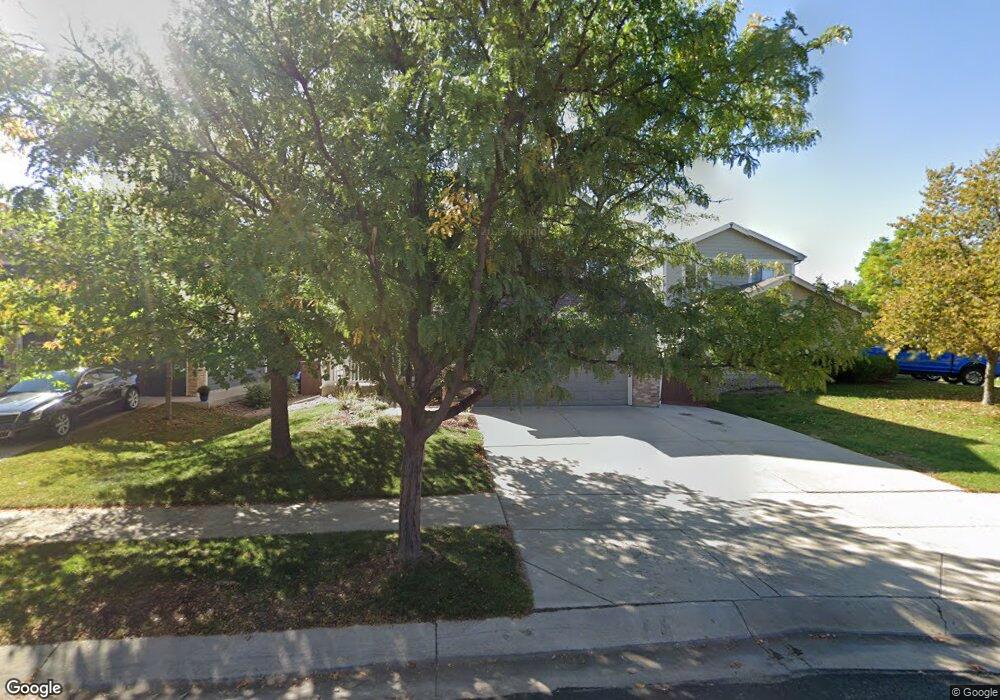
5228 Nighthawk Pkwy Brighton, CO 80601
Estimated Value: $443,000 - $467,000
3
Beds
2
Baths
2,269
Sq Ft
$199/Sq Ft
Est. Value
About This Home
This home is located at 5228 Nighthawk Pkwy, Brighton, CO 80601 and is currently estimated at $452,195, approximately $199 per square foot. 5228 Nighthawk Pkwy is a home located in Adams County with nearby schools including Pennock Elementary School, Overland Trail Middle School, and Brighton High School.
Ownership History
Date
Name
Owned For
Owner Type
Purchase Details
Closed on
Feb 29, 2012
Sold by
Federal Home Loan Mortgage Corporation
Bought by
Engelhardt Craig A and Engelhardt Shari A
Current Estimated Value
Home Financials for this Owner
Home Financials are based on the most recent Mortgage that was taken out on this home.
Original Mortgage
$159,125
Interest Rate
3.87%
Mortgage Type
FHA
Purchase Details
Closed on
Jul 6, 2011
Sold by
Tutty John D and Tutty Stacia A
Bought by
Federal Home Loan Mortgage Corp
Purchase Details
Closed on
May 26, 2000
Sold by
U S Home Corporation
Bought by
Tutty John D and Tutty Stacia A
Home Financials for this Owner
Home Financials are based on the most recent Mortgage that was taken out on this home.
Original Mortgage
$157,000
Interest Rate
8.14%
Create a Home Valuation Report for This Property
The Home Valuation Report is an in-depth analysis detailing your home's value as well as a comparison with similar homes in the area
Home Values in the Area
Average Home Value in this Area
Purchase History
| Date | Buyer | Sale Price | Title Company |
|---|---|---|---|
| Engelhardt Craig A | $163,265 | Servicelink | |
| Federal Home Loan Mortgage Corp | -- | None Available | |
| Tutty John D | $161,075 | -- |
Source: Public Records
Mortgage History
| Date | Status | Borrower | Loan Amount |
|---|---|---|---|
| Previous Owner | Engelhardt Craig A | $159,125 | |
| Previous Owner | Tutty John D | $157,000 |
Source: Public Records
Tax History Compared to Growth
Tax History
| Year | Tax Paid | Tax Assessment Tax Assessment Total Assessment is a certain percentage of the fair market value that is determined by local assessors to be the total taxable value of land and additions on the property. | Land | Improvement |
|---|---|---|---|---|
| 2024 | $5,045 | $28,570 | $5,940 | $22,630 |
| 2023 | $5,026 | $33,220 | $6,430 | $26,790 |
| 2022 | $4,326 | $24,970 | $5,910 | $19,060 |
| 2021 | $4,170 | $24,970 | $5,910 | $19,060 |
| 2020 | $3,798 | $23,660 | $5,790 | $17,870 |
| 2019 | $3,803 | $23,660 | $5,790 | $17,870 |
| 2018 | $3,332 | $20,690 | $6,480 | $14,210 |
| 2017 | $3,335 | $20,690 | $6,480 | $14,210 |
| 2016 | $2,412 | $15,460 | $3,180 | $12,280 |
| 2015 | $2,402 | $15,460 | $3,180 | $12,280 |
| 2014 | -- | $13,110 | $2,630 | $10,480 |
Source: Public Records
Map
Nearby Homes
- 5113 Grey Swallow St
- 5157 Goshawk St
- 4950 Mount Cameron Dr
- 5224 Snow Goose St
- 33 Gaviota Ave
- 5292 Goldfinch St
- 4828 Mount Cameron Dr
- 5055 Pelican St
- 5092 Sparrow St
- 102 Pelican Ave
- 4749 Mount Shavano St
- 5624 Killdeer St Unit 5624
- 12 Golden Eagle Pkwy Unit 12
- 4670 Quandary Peak St
- 4723 Crestone Peak St
- 4641 Quandary Peak St
- 4589 Quandary Peak St
- 4591 Crestone Peak St
- 5161 Chicory Cir
- 4454 Mount Lincoln St
- 5238 Nighthawk Pkwy
- 5218 Nighthawk Pkwy
- 5258 Nighthawk Pkwy
- 5221 Grey Swallow St
- 5211 Grey Swallow St
- 5231 Grey Swallow St
- 5194 Nighthawk Pkwy
- 5241 Grey Swallow St
- 5219 Nighthawk Pkwy
- 5249 Nighthawk Pkwy
- 5278 Nighthawk Pkwy
- 5183 Grey Swallow St
- 5269 Nighthawk Pkwy
- 5184 Nighthawk Pkwy
- 5195 Nighthawk Pkwy
- 454 Crane St
- 5173 Grey Swallow St
- 5288 Nighthawk Pkwy
- 5279 Nighthawk Pkwy
- 5251 Grey Swallow St