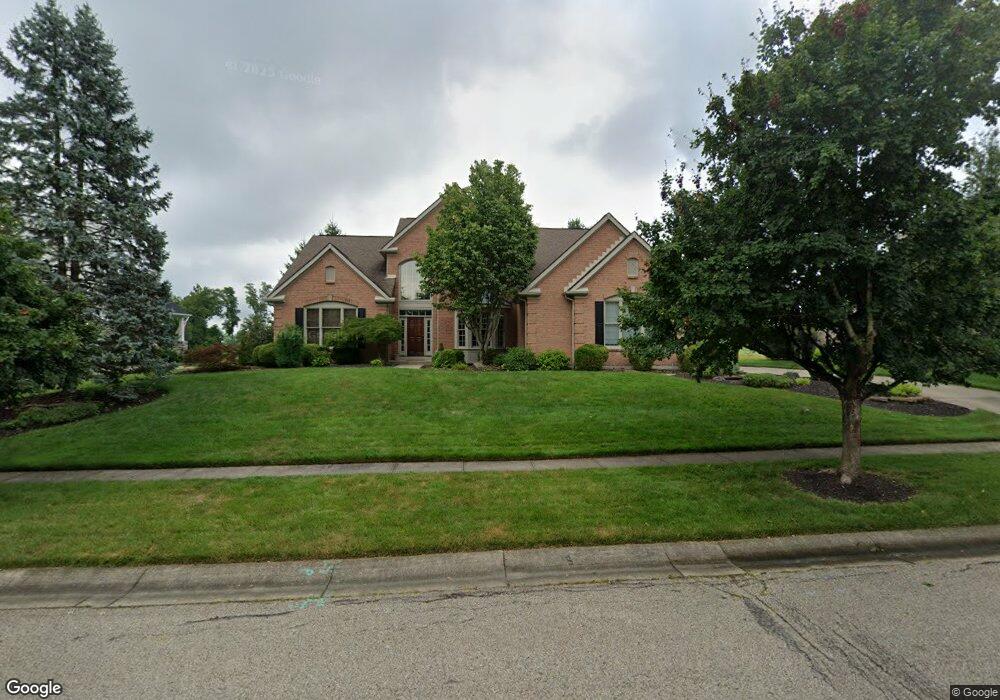
5228 Vista Point Dr Unit 5 Maineville, OH 45039
Hamilton Township NeighborhoodEstimated Value: $808,000 - $903,000
4
Beds
4
Baths
5,312
Sq Ft
$160/Sq Ft
Est. Value
About This Home
This home is located at 5228 Vista Point Dr Unit 5, Maineville, OH 45039 and is currently estimated at $847,504, approximately $159 per square foot. 5228 Vista Point Dr Unit 5 is a home located in Warren County with nearby schools including Kings Junior High School, Kings High School, and Lebanon Christian Schools.
Ownership History
Date
Name
Owned For
Owner Type
Purchase Details
Closed on
Jul 6, 2020
Sold by
Lewis Robert B and Lewis Jill L
Bought by
Vandewalle James A and Vandewalle Micaila D
Current Estimated Value
Home Financials for this Owner
Home Financials are based on the most recent Mortgage that was taken out on this home.
Original Mortgage
$464,900
Outstanding Balance
$413,007
Interest Rate
3.2%
Mortgage Type
New Conventional
Estimated Equity
$434,497
Purchase Details
Closed on
Jan 3, 2003
Sold by
Zicka Walker Homes
Bought by
Lewis Robert B and Lewis Jill L
Home Financials for this Owner
Home Financials are based on the most recent Mortgage that was taken out on this home.
Original Mortgage
$460,450
Interest Rate
6.13%
Mortgage Type
New Conventional
Purchase Details
Closed on
Feb 1, 2000
Sold by
Rivers Bend Land Co
Bought by
Zicka /Walker Homes At Rivers Bend Ltd
Create a Home Valuation Report for This Property
The Home Valuation Report is an in-depth analysis detailing your home's value as well as a comparison with similar homes in the area
Home Values in the Area
Average Home Value in this Area
Purchase History
| Date | Buyer | Sale Price | Title Company |
|---|---|---|---|
| Vandewalle James A | $534,900 | Premier Service Ttl Agcy Llc | |
| Lewis Robert B | $575,000 | -- | |
| Zicka /Walker Homes At Rivers Bend Ltd | $118,900 | -- |
Source: Public Records
Mortgage History
| Date | Status | Borrower | Loan Amount |
|---|---|---|---|
| Open | Vandewalle James A | $464,900 | |
| Previous Owner | Lewis Robert B | $460,450 |
Source: Public Records
Tax History Compared to Growth
Tax History
| Year | Tax Paid | Tax Assessment Tax Assessment Total Assessment is a certain percentage of the fair market value that is determined by local assessors to be the total taxable value of land and additions on the property. | Land | Improvement |
|---|---|---|---|---|
| 2024 | $11,639 | $222,660 | $47,250 | $175,410 |
| 2023 | $10,808 | $186,140 | $40,043 | $146,097 |
| 2022 | $10,698 | $186,141 | $40,044 | $146,097 |
| 2021 | $8,980 | $186,141 | $40,044 | $146,097 |
| 2020 | $8,971 | $164,728 | $35,438 | $129,290 |
| 2019 | $9,084 | $164,728 | $35,438 | $129,290 |
| 2018 | $8,585 | $164,728 | $35,438 | $129,290 |
| 2017 | $10,239 | $165,606 | $35,910 | $129,696 |
| 2016 | $10,494 | $165,606 | $35,910 | $129,696 |
| 2015 | $9,480 | $165,606 | $35,910 | $129,696 |
| 2014 | $9,960 | $165,610 | $35,910 | $129,700 |
| 2013 | $9,976 | $217,900 | $47,250 | $170,650 |
Source: Public Records
Map
Nearby Homes
- 385 Glen Abbey Ln
- 367 Glen Abbey Ln
- Keating Plan at Cypress Pointe
- 379 Glen Abbey Ln
- 5087 Emerald View Dr
- 22 Snook Rd
- 415 Glen Abbey Ln
- 421 Glen Abbey Ln
- 427 Glen Abbey Ln
- 433 Glen Abbey Ln
- 0 Deere Run Ln Unit 1836428
- 97 Bedles Ct
- 0 Winding River Blvd Unit 1852146
- 580 Winding River Blvd
- 10 AC Winding River Blvd
- 219 Chateau Valley Ln
- 894 Winding River Blvd
- 329 Stone Ridge Blvd
- 5255 Red Flower Ln
- 4825 Lakeview Ct
- 5228 Vista Point Dr
- 79 Vista Point Dr Unit 79
- 45 Vista Point Dr Unit 45
- 58 Vista Point Dr Unit 58
- 33 Vista Point Dr Unit 33
- 34 Vista Point Dr Unit 34
- 73 Vista Point Dr Unit 73
- 32 Vista Point Dr Unit 32
- 46 Vista Point Dr Unit 46
- 43 Vista Point Dr Unit 43
- 51 Vista Point Dr Unit 51
- 49 Vista Point Dr Unit 49
- 5202 Vista Point Dr
- 5202 Vista Point Dr Unit 4
- 5252 Vista Point Dr
- 5252 Vista Point Dr Unit 6
- 18 Ridgevale Ct
- 5178 Vista Point Dr
- 5278 Vista Point Dr
- 45 Fox Chapel Run