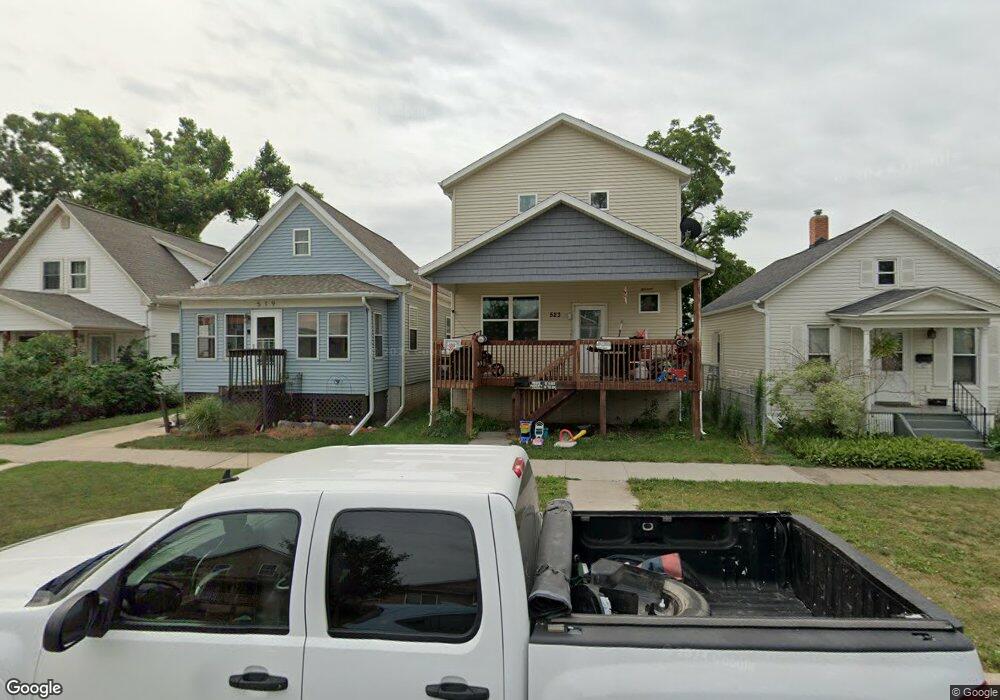
523 B Ave NW Cedar Rapids, IA 52405
Northwest Area NeighborhoodEstimated Value: $127,000 - $224,000
3
Beds
2
Baths
1,320
Sq Ft
$139/Sq Ft
Est. Value
About This Home
This home is located at 523 B Ave NW, Cedar Rapids, IA 52405 and is currently estimated at $183,069, approximately $138 per square foot. 523 B Ave NW is a home located in Linn County with nearby schools including Junction City Elementary School, Harrison Elementary School, and Kentucky Tech - Ashland Reg Tech Center.
Ownership History
Date
Name
Owned For
Owner Type
Purchase Details
Closed on
Jan 6, 2017
Sold by
Platinum Development Llc
Bought by
Tatro Christine L
Current Estimated Value
Purchase Details
Closed on
Sep 22, 2011
Sold by
Vargas Elsa and Robles Nactanael
Bought by
City Of Cedar Rapids
Purchase Details
Closed on
Jul 10, 2006
Sold by
Lekin Nancy L
Bought by
Vargas Elsa
Home Financials for this Owner
Home Financials are based on the most recent Mortgage that was taken out on this home.
Original Mortgage
$37,950
Interest Rate
6.73%
Mortgage Type
Unknown
Purchase Details
Closed on
Jul 31, 1998
Sold by
Price Mary D
Bought by
Lekin Shawn M and Lekin Nancy L
Home Financials for this Owner
Home Financials are based on the most recent Mortgage that was taken out on this home.
Original Mortgage
$20,250
Interest Rate
7.03%
Create a Home Valuation Report for This Property
The Home Valuation Report is an in-depth analysis detailing your home's value as well as a comparison with similar homes in the area
Home Values in the Area
Average Home Value in this Area
Purchase History
| Date | Buyer | Sale Price | Title Company |
|---|---|---|---|
| Tatro Christine L | -- | None Available | |
| City Of Cedar Rapids | $42,500 | None Available | |
| Vargas Elsa | $39,500 | None Available | |
| Lekin Shawn M | $26,500 | -- |
Source: Public Records
Mortgage History
| Date | Status | Borrower | Loan Amount |
|---|---|---|---|
| Previous Owner | Vargas Elsa | $37,950 | |
| Previous Owner | Lekin Shawn M | $20,250 |
Source: Public Records
Tax History Compared to Growth
Tax History
| Year | Tax Paid | Tax Assessment Tax Assessment Total Assessment is a certain percentage of the fair market value that is determined by local assessors to be the total taxable value of land and additions on the property. | Land | Improvement |
|---|---|---|---|---|
| 2025 | $2,828 | $207,300 | $18,000 | $189,300 |
| 2024 | $3,672 | $188,500 | $18,000 | $170,500 |
| 2023 | $3,672 | $170,300 | $18,000 | $152,300 |
| 2022 | $3,254 | $183,000 | $16,500 | $166,500 |
| 2021 | $3,226 | $166,000 | $16,500 | $149,500 |
| 2020 | $3,226 | $154,800 | $13,500 | $141,300 |
| 2019 | $2,942 | $136,500 | $9,000 | $127,500 |
| 2018 | $2,352 | $136,500 | $9,000 | $127,500 |
| 2017 | $266 | $12,200 | $9,000 | $3,200 |
| 2016 | $192 | $9,000 | $9,000 | $0 |
| 2015 | -- | $0 | $0 | $0 |
| 2014 | -- | $0 | $0 | $0 |
| 2013 | $96 | $0 | $0 | $0 |
Source: Public Records
Map
Nearby Homes