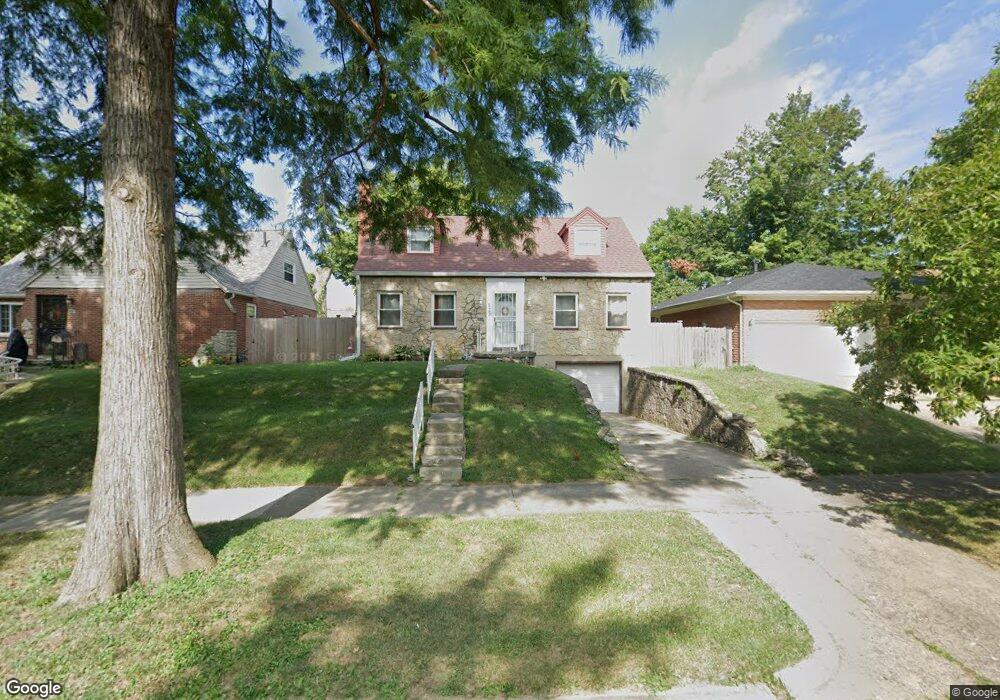
523 Gondert Ave Dayton, OH 45403
Eastern Hills NeighborhoodEstimated Value: $108,000 - $153,078
4
Beds
1
Bath
1,537
Sq Ft
$90/Sq Ft
Est. Value
About This Home
This home is located at 523 Gondert Ave, Dayton, OH 45403 and is currently estimated at $139,020, approximately $90 per square foot. 523 Gondert Ave is a home located in Montgomery County with nearby schools including Ruskin Elementary School, Kiser Elementary, and Horizon Science Academy Dayton Downtown.
Ownership History
Date
Name
Owned For
Owner Type
Purchase Details
Closed on
Nov 30, 2020
Sold by
523 Gondert Llc
Bought by
Linsenbigier Kristy Michele
Current Estimated Value
Home Financials for this Owner
Home Financials are based on the most recent Mortgage that was taken out on this home.
Original Mortgage
$80,264
Outstanding Balance
$71,459
Interest Rate
2.7%
Mortgage Type
New Conventional
Estimated Equity
$67,561
Purchase Details
Closed on
Jun 20, 2012
Sold by
Yates Anthony R and Yates Stacy A
Bought by
523 Gondert Llc
Purchase Details
Closed on
Jan 24, 2011
Sold by
Anspach Robert E
Bought by
Yates Anthony R
Purchase Details
Closed on
Dec 6, 2000
Sold by
Stanford Brian C
Bought by
Anspach Robert E
Home Financials for this Owner
Home Financials are based on the most recent Mortgage that was taken out on this home.
Original Mortgage
$76,200
Interest Rate
7.83%
Mortgage Type
FHA
Purchase Details
Closed on
Jun 29, 1994
Sold by
Flohre Nancy
Bought by
Stanford Brian C
Create a Home Valuation Report for This Property
The Home Valuation Report is an in-depth analysis detailing your home's value as well as a comparison with similar homes in the area
Home Values in the Area
Average Home Value in this Area
Purchase History
| Date | Buyer | Sale Price | Title Company |
|---|---|---|---|
| Linsenbigier Kristy Michele | $60,000 | Pctitle Pros | |
| 523 Gondert Llc | -- | None Available | |
| Yates Anthony R | $18,900 | Attorney | |
| Anspach Robert E | $76,900 | -- | |
| Stanford Brian C | $59,900 | -- |
Source: Public Records
Mortgage History
| Date | Status | Borrower | Loan Amount |
|---|---|---|---|
| Open | Linsenbigier Kristy Michele | $80,264 | |
| Previous Owner | Anspach Robert E | $76,200 |
Source: Public Records
Tax History Compared to Growth
Tax History
| Year | Tax Paid | Tax Assessment Tax Assessment Total Assessment is a certain percentage of the fair market value that is determined by local assessors to be the total taxable value of land and additions on the property. | Land | Improvement |
|---|---|---|---|---|
| 2024 | $2,101 | $37,440 | $5,840 | $31,600 |
| 2023 | $2,101 | $37,440 | $5,840 | $31,600 |
| 2022 | $2,024 | $27,890 | $4,360 | $23,530 |
| 2021 | $2,067 | $27,890 | $4,360 | $23,530 |
| 2020 | $2,009 | $27,890 | $4,360 | $23,530 |
| 2019 | $975 | $11,490 | $4,360 | $7,130 |
| 2018 | $977 | $11,490 | $4,360 | $7,130 |
| 2017 | $970 | $11,490 | $4,360 | $7,130 |
| 2016 | $1,044 | $11,820 | $4,360 | $7,460 |
| 2015 | $990 | $11,820 | $4,360 | $7,460 |
| 2014 | $990 | $11,820 | $4,360 | $7,460 |
| 2012 | -- | $25,390 | $6,740 | $18,650 |
Source: Public Records
Map
Nearby Homes
- 515 Heiss Ave Unit 515-517
- 715 Gondert Ave
- 631 Greenlawn Ave
- 1323 Huffman Ave
- 520 S Smithville Rd
- 1614 Huffman Ave Unit 1612
- 1629 Suman Ave
- 404 S Smithville Rd
- 1626 Darst Ave
- 1620 Gondert Ave Unit 1618
- 1620 Gondert Ave
- 763 Greenlawn Ave
- 1700 Suman Ave
- 223 Pleasant Ave
- 40 Klee Ave
- 1345 Jordan Ave
- 227 Livingston Ave Unit 225
- 1714 Gondert Ave
- 1730 Darst Ave
- 115 Oaklawn Ave
- 519 Gondert Ave
- 527 Gondert Ave
- 515 Gondert Ave
- 531 Gondert Ave
- 532 S Wright Ave
- 520 S Wright Ave
- 550 Elberon Ave
- 539 Gondert Ave
- 536 S Wright Ave
- 520 Gondert Ave
- 524 Gondert Ave
- 516 Gondert Ave
- 556 Elberon Ave
- 1440 Huffman Ave
- 528 Gondert Ave
- 1434 Huffman Ave
- 1446 Huffman Ave
- 512 Gondert Ave
- 532 Gondert Ave
- 1428 Huffman Ave