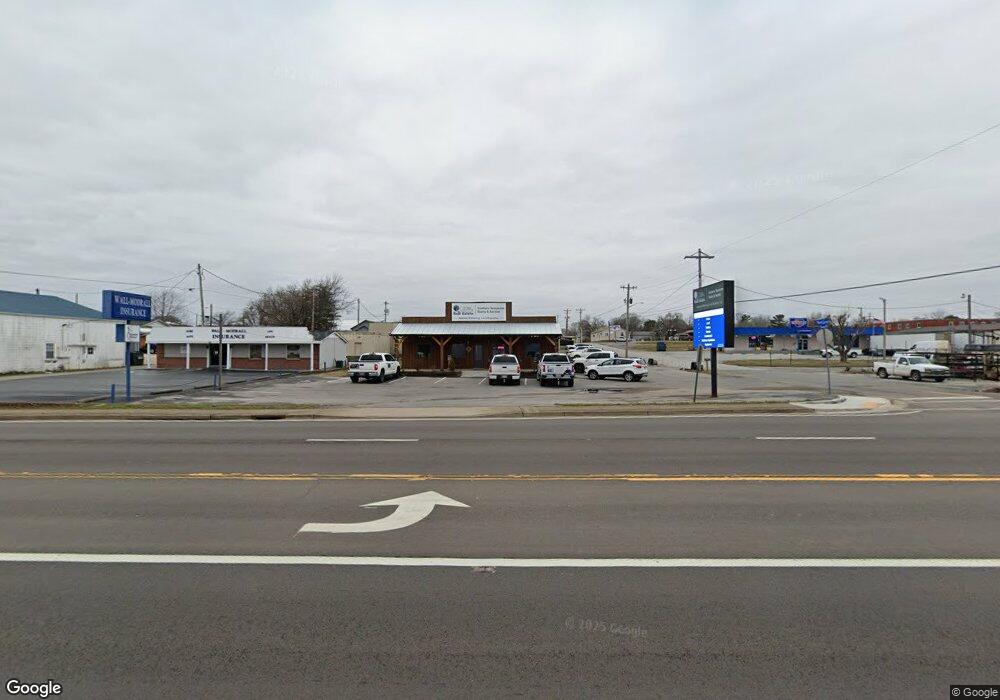
523 N Locust Ave Lawrenceburg, TN 38464
Estimated Value: $160,904
--
Bed
--
Bath
2,688
Sq Ft
$60/Sq Ft
Est. Value
About This Home
This home is located at 523 N Locust Ave, Lawrenceburg, TN 38464 and is currently priced at $160,904, approximately $59 per square foot. 523 N Locust Ave is a home located in Lawrence County with nearby schools including Ingram Sowell Elementary School, Lawrenceburg Public Elementary School, and David Crockett Elementary School.
Ownership History
Date
Name
Owned For
Owner Type
Purchase Details
Closed on
Sep 4, 2020
Sold by
Ferguson John
Bought by
Faulkner Gaylon
Current Estimated Value
Purchase Details
Closed on
Jul 1, 2016
Sold by
Hayes Bruce
Bought by
Ferguson John
Purchase Details
Closed on
May 4, 2005
Sold by
Bruce Hayes
Bought by
State Of Tennessee
Purchase Details
Closed on
Dec 23, 1992
Bought by
Hayes Bruce and Hayes Kathy L
Purchase Details
Closed on
Jun 8, 1972
Bought by
Hayes Everett E
Create a Home Valuation Report for This Property
The Home Valuation Report is an in-depth analysis detailing your home's value as well as a comparison with similar homes in the area
Home Values in the Area
Average Home Value in this Area
Purchase History
| Date | Buyer | Sale Price | Title Company |
|---|---|---|---|
| Faulkner Gaylon | $125,000 | None Available | |
| Ferguson John | $100,000 | -- | |
| State Of Tennessee | -- | -- | |
| Hayes Bruce | $50,000 | -- | |
| Hayes Everett E | -- | -- |
Source: Public Records
Tax History Compared to Growth
Tax History
| Year | Tax Paid | Tax Assessment Tax Assessment Total Assessment is a certain percentage of the fair market value that is determined by local assessors to be the total taxable value of land and additions on the property. | Land | Improvement |
|---|---|---|---|---|
| 2025 | $3,286 | $105,720 | $0 | $0 |
| 2024 | $2,657 | $105,720 | $24,200 | $81,520 |
| 2023 | $2,657 | $105,720 | $24,200 | $81,520 |
| 2022 | $762 | $24,520 | $24,200 | $320 |
| 2021 | $1,076 | $24,480 | $24,200 | $280 |
| 2020 | $1,319 | $24,480 | $24,200 | $280 |
| 2019 | $1,319 | $30,000 | $24,200 | $5,800 |
| 2018 | $1,319 | $30,000 | $24,200 | $5,800 |
| 2017 | $1,319 | $30,000 | $24,200 | $5,800 |
| 2016 | $1,319 | $30,000 | $24,200 | $5,800 |
| 2015 | $1,249 | $30,000 | $24,200 | $5,800 |
| 2014 | $1,115 | $26,800 | $22,000 | $4,800 |
Source: Public Records
Map
Nearby Homes