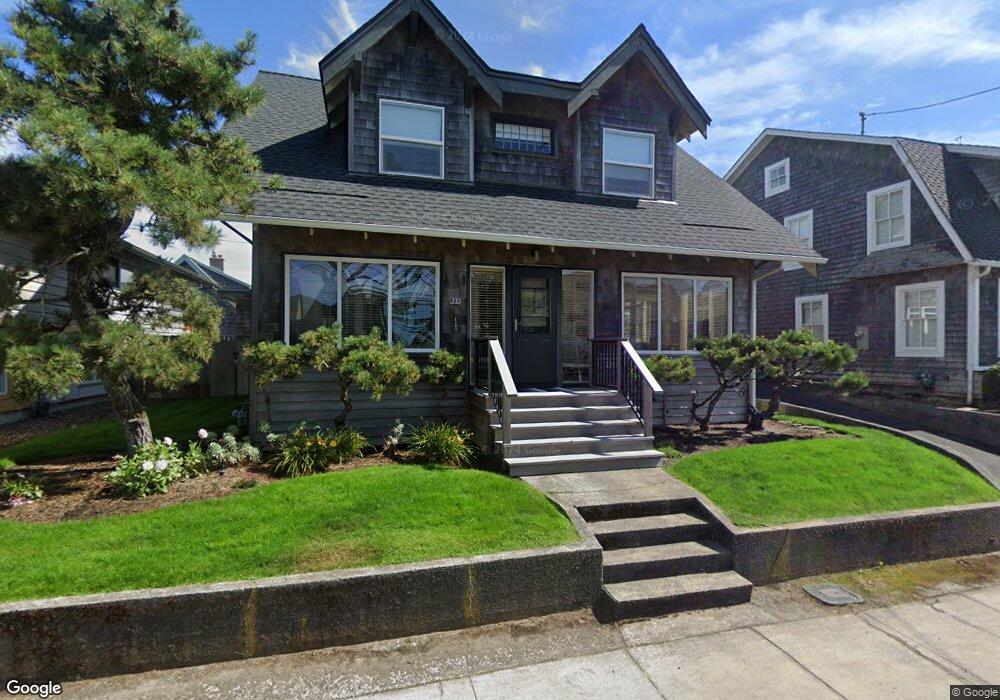
523 S Ocean Ave Seaside, OR 97138
Estimated Value: $1,451,000 - $1,756,000
4
Beds
3
Baths
1,430
Sq Ft
$1,123/Sq Ft
Est. Value
About This Home
This home is located at 523 S Ocean Ave, Seaside, OR 97138 and is currently estimated at $1,606,239, approximately $1,123 per square foot. 523 S Ocean Ave is a home with nearby schools including Seaside High School.
Ownership History
Date
Name
Owned For
Owner Type
Purchase Details
Closed on
Mar 29, 2023
Sold by
Lilley Caroline Stimson
Bought by
Caroline S Lilley Revocable Trust
Current Estimated Value
Purchase Details
Closed on
Nov 8, 2022
Sold by
Evensen Clara Wing Lilley
Bought by
Clara Evensen Revocable Trust
Purchase Details
Closed on
Sep 1, 2020
Sold by
Lilley Elizabeth Jane and Elizabeth Jane Lilley Trust
Bought by
Lilley French Kathryn Jane and Lilley Evensen Clara
Purchase Details
Closed on
Nov 5, 2019
Sold by
Lilley Charles S
Bought by
Lilley Charles S and Charles S Lilley Trust
Purchase Details
Closed on
May 1, 2012
Sold by
Lilley Douglas Frederick
Bought by
Lilley Charles Stimson and Lilley Elizabeth Jane
Purchase Details
Closed on
Jan 5, 2012
Sold by
Evans Sylvia Page
Bought by
Lilley Charles Stimson and Lilley Elizabeth Jane
Purchase Details
Closed on
Dec 23, 2011
Sold by
Evans Sylvia Page
Bought by
Lilley Charles Stimson and Lilley Elizabeth Jane
Purchase Details
Closed on
Oct 3, 2006
Sold by
Evans Sylvia Page Lilley
Bought by
Evans Sylvia Page and Sylvia Page Evans Trust
Create a Home Valuation Report for This Property
The Home Valuation Report is an in-depth analysis detailing your home's value as well as a comparison with similar homes in the area
Home Values in the Area
Average Home Value in this Area
Purchase History
| Date | Buyer | Sale Price | Title Company |
|---|---|---|---|
| Caroline S Lilley Revocable Trust | -- | None Listed On Document | |
| Clara Evensen Revocable Trust | -- | -- | |
| Lilley French Kathryn Jane | -- | None Available | |
| Lilley Charles S | -- | None Available | |
| Lilley Charles Stimson | -- | None Available | |
| Lilley Charles Stimson | -- | None Available | |
| Lilley Charles Stimson | -- | None Available | |
| Evans Sylvia Page | -- | None Available |
Source: Public Records
Tax History Compared to Growth
Tax History
| Year | Tax Paid | Tax Assessment Tax Assessment Total Assessment is a certain percentage of the fair market value that is determined by local assessors to be the total taxable value of land and additions on the property. | Land | Improvement |
|---|---|---|---|---|
| 2024 | $8,253 | $721,572 | -- | -- |
| 2023 | $8,022 | $700,556 | $0 | $0 |
| 2022 | $7,781 | $680,153 | $0 | $0 |
| 2021 | $7,943 | $660,344 | $0 | $0 |
| 2020 | $7,662 | $641,112 | $0 | $0 |
| 2019 | $7,465 | $622,440 | $0 | $0 |
| 2018 | $7,195 | $604,312 | $0 | $0 |
| 2017 | $7,004 | $586,711 | $0 | $0 |
| 2016 | $6,050 | $569,624 | $417,962 | $151,662 |
| 2015 | $5,851 | $553,034 | $405,789 | $147,245 |
| 2014 | $5,562 | $536,927 | $0 | $0 |
| 2013 | -- | $521,290 | $0 | $0 |
Source: Public Records
Map
Nearby Homes
- 0 Wellington Ave Unit 25-48
- 0 Wellington Ave Unit 1202
- 924 Little Beach Dr
- 1265 D St
- 1396 N Ocean Ave
- 196 Dylan Ct
- 782 Woodland Ct
- 415 Spruce Ave
- Lots 25-26 5th St
- 2624 Neawanna St
- 766 Neacoxie Blvd
- 2549 Neawanna St
- 856 Neacoxie Blvd
- 856 Neacoxie Blvd Unit 311
- 0 5th St
- 714 7th St
- 3387-3389 U S 101
- 3389 U S 101
- 101 13th St Unit 209
- 000 Neawanna St