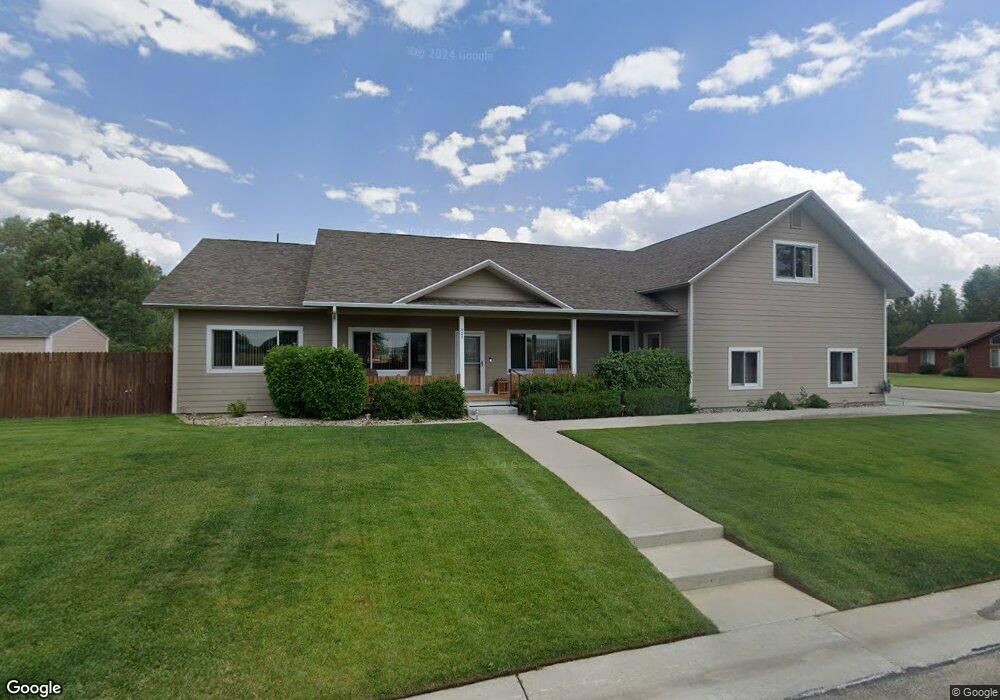
523 S Shanley Ave Pinedale, WY 82941
Estimated Value: $527,000 - $813,000
3
Beds
3
Baths
3,028
Sq Ft
$224/Sq Ft
Est. Value
About This Home
This home is located at 523 S Shanley Ave, Pinedale, WY 82941 and is currently estimated at $677,335, approximately $223 per square foot. 523 S Shanley Ave is a home located in Sublette County with nearby schools including Pinedale High School.
Ownership History
Date
Name
Owned For
Owner Type
Purchase Details
Closed on
Nov 10, 2014
Sold by
Johnston George Dwayne and Johnston Gloria
Bought by
Johnston George Dwayne and Johnston Gloria
Current Estimated Value
Purchase Details
Closed on
Jul 14, 2008
Sold by
Wyoming Corporation
Bought by
Triple Peaks Investments Llc
Home Financials for this Owner
Home Financials are based on the most recent Mortgage that was taken out on this home.
Original Mortgage
$92,022
Outstanding Balance
$60,233
Interest Rate
6.36%
Mortgage Type
Purchase Money Mortgage
Estimated Equity
$617,102
Purchase Details
Closed on
Jan 29, 2008
Sold by
Sprouting Willow Llc
Bought by
Johnston George Dwayne and Johnston Gloria
Home Financials for this Owner
Home Financials are based on the most recent Mortgage that was taken out on this home.
Original Mortgage
$368,000
Interest Rate
6.15%
Mortgage Type
New Conventional
Create a Home Valuation Report for This Property
The Home Valuation Report is an in-depth analysis detailing your home's value as well as a comparison with similar homes in the area
Home Values in the Area
Average Home Value in this Area
Purchase History
| Date | Buyer | Sale Price | Title Company |
|---|---|---|---|
| Johnston George Dwayne | -- | None Available | |
| Triple Peaks Investments Llc | -- | None Available | |
| Johnston George Dwayne | -- | None Available |
Source: Public Records
Mortgage History
| Date | Status | Borrower | Loan Amount |
|---|---|---|---|
| Open | Triple Peaks Investments Llc | $92,022 | |
| Previous Owner | Johnston George Dwayne | $368,000 |
Source: Public Records
Tax History Compared to Growth
Tax History
| Year | Tax Paid | Tax Assessment Tax Assessment Total Assessment is a certain percentage of the fair market value that is determined by local assessors to be the total taxable value of land and additions on the property. | Land | Improvement |
|---|---|---|---|---|
| 2025 | $3,605 | $50,482 | $5,187 | $45,295 |
| 2024 | $4,508 | $64,696 | $6,650 | $58,046 |
| 2023 | $4,242 | $61,839 | $5,985 | $55,854 |
| 2022 | $3,399 | $49,013 | $4,168 | $44,845 |
| 2021 | $2,665 | $45,693 | $3,359 | $42,334 |
| 2020 | $2,665 | $39,771 | $3,137 | $36,634 |
| 2019 | $2,623 | $39,472 | $4,191 | $35,281 |
| 2018 | $2,421 | $36,515 | $4,152 | $32,363 |
| 2017 | $2,365 | $35,395 | $4,152 | $31,243 |
| 2016 | $2,338 | $35,229 | $4,152 | $31,077 |
| 2015 | -- | $35,403 | $3,990 | $31,413 |
| 2014 | -- | $32,160 | $3,990 | $28,170 |
| 2013 | -- | $31,765 | $4,275 | $27,490 |
Source: Public Records
Map
Nearby Homes
- 210 Spruce St
- 6 Opal St
- 469 S Madison Ave
- 0 Stone Trail Unit 24-114
- 0 Tbd Stone Trail
- 344 S Shanley Ave
- LOT 1 Jade St
- LOT 3 Jade St
- LOT 2 Jade St
- 0 Tbd Agate St
- 1 Cliftons
- 376 S Ashley Ave
- 20 Granite Ln
- 315 S Fremont Ave
- 379 Colter Loop
- 373 Colter Loop
- 9 Wilson St
- 11 Wilson St
- 367 S Colter Ave
- 269 S Cole Ave