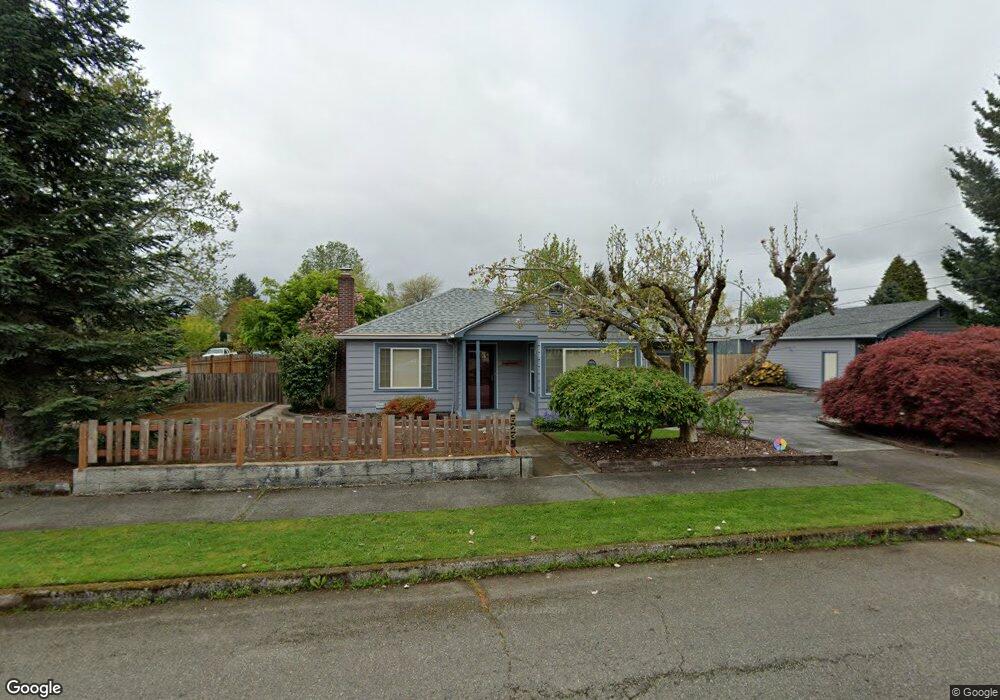
523 Thomas St SW Olympia, WA 98502
South Westside NeighborhoodEstimated Value: $457,742 - $507,000
2
Beds
1
Bath
1,231
Sq Ft
$388/Sq Ft
Est. Value
About This Home
This home is located at 523 Thomas St SW, Olympia, WA 98502 and is currently estimated at $477,936, approximately $388 per square foot. 523 Thomas St SW is a home located in Thurston County with nearby schools including Garfield Elementary School, Jefferson Middle School, and Capital High School.
Ownership History
Date
Name
Owned For
Owner Type
Purchase Details
Closed on
Dec 21, 2005
Sold by
Smith Candice R
Bought by
Trejo Lillian L
Current Estimated Value
Home Financials for this Owner
Home Financials are based on the most recent Mortgage that was taken out on this home.
Original Mortgage
$109,000
Interest Rate
6.35%
Mortgage Type
Fannie Mae Freddie Mac
Purchase Details
Closed on
Aug 21, 1997
Sold by
Jensen Nels Erik and Jensen Tina Marie
Bought by
Smith Candice R and Trejo Lillian L
Home Financials for this Owner
Home Financials are based on the most recent Mortgage that was taken out on this home.
Original Mortgage
$126,000
Interest Rate
7.43%
Purchase Details
Closed on
Jan 14, 1997
Sold by
Opsata James A and Opsata Victoria B
Bought by
Jensen Nels Erik and Jensen Tina Marie
Home Financials for this Owner
Home Financials are based on the most recent Mortgage that was taken out on this home.
Original Mortgage
$109,407
Interest Rate
7.74%
Mortgage Type
FHA
Create a Home Valuation Report for This Property
The Home Valuation Report is an in-depth analysis detailing your home's value as well as a comparison with similar homes in the area
Home Values in the Area
Average Home Value in this Area
Purchase History
| Date | Buyer | Sale Price | Title Company |
|---|---|---|---|
| Trejo Lillian L | $53,806 | Stewart Title Of Western | |
| Smith Candice R | $140,000 | First American Title | |
| Jensen Nels Erik | $110,000 | Transnation Title Insurance |
Source: Public Records
Mortgage History
| Date | Status | Borrower | Loan Amount |
|---|---|---|---|
| Closed | Trejo Lillian L | $109,000 | |
| Previous Owner | Smith Candice R | $126,000 | |
| Previous Owner | Jensen Nels Erik | $109,407 |
Source: Public Records
Tax History Compared to Growth
Tax History
| Year | Tax Paid | Tax Assessment Tax Assessment Total Assessment is a certain percentage of the fair market value that is determined by local assessors to be the total taxable value of land and additions on the property. | Land | Improvement |
|---|---|---|---|---|
| 2024 | $3,953 | $392,500 | $163,200 | $229,300 |
| 2023 | $3,953 | $377,700 | $133,900 | $243,800 |
| 2022 | $3,779 | $369,600 | $108,000 | $261,600 |
| 2021 | $3,235 | $316,100 | $97,500 | $218,600 |
| 2020 | $3,238 | $250,300 | $80,700 | $169,600 |
| 2019 | $2,865 | $244,400 | $70,800 | $173,600 |
| 2018 | $2,874 | $213,300 | $58,700 | $154,600 |
| 2017 | $2,258 | $180,400 | $67,200 | $113,200 |
| 2016 | $1,988 | $166,400 | $61,600 | $104,800 |
| 2014 | -- | $158,650 | $60,350 | $98,300 |
Source: Public Records
Map
Nearby Homes
- 113 Decatur St NW
- 101 Rogers St NW
- 821 Thomas St SW
- 236 Milroy St NW
- 1424 11th Ave SW
- 1108 Harrison Ave NW
- 303 Decatur St NW
- 805 5th Ave SW
- 214 Sherman St NW
- 328 Percival St NW
- 2300 9th Ave SW Unit A5
- 933 Fern St SW Unit 933
- 1720 Madison Ave NW
- 2004 15th Ave SW
- 1516 Decatur St SW Unit 210
- 1801 Evergreen Park Ct SW Unit 10
- 1709 Fern St SW
- 1724 Dickinson Ave NW
- 1720 Dickinson Ave NW
- 1910 Evergreen Park Dr SW Unit 905
- 1510 6th Ave SW
- 509 Thomas St SW
- 1420 6th Ave SW
- 1518 6th Ave SW
- 1503 5th Ave SW
- 1416 6th Ave SW
- 1511 5th Ave SW
- 1515 5th Ave SW
- 1421 5th Ave SW
- 1509 6th Ave SW
- 1414 6th Ave SW
- 1511 6th Ave SW
- 606 Thomas St SW
- 1521 5th Ave SW
- 1415 5th Ave SW
- 1519 6th Ave SW
- 1415 6th Ave SW
- 517 Plymouth St SW
- 523 Plymouth St SW