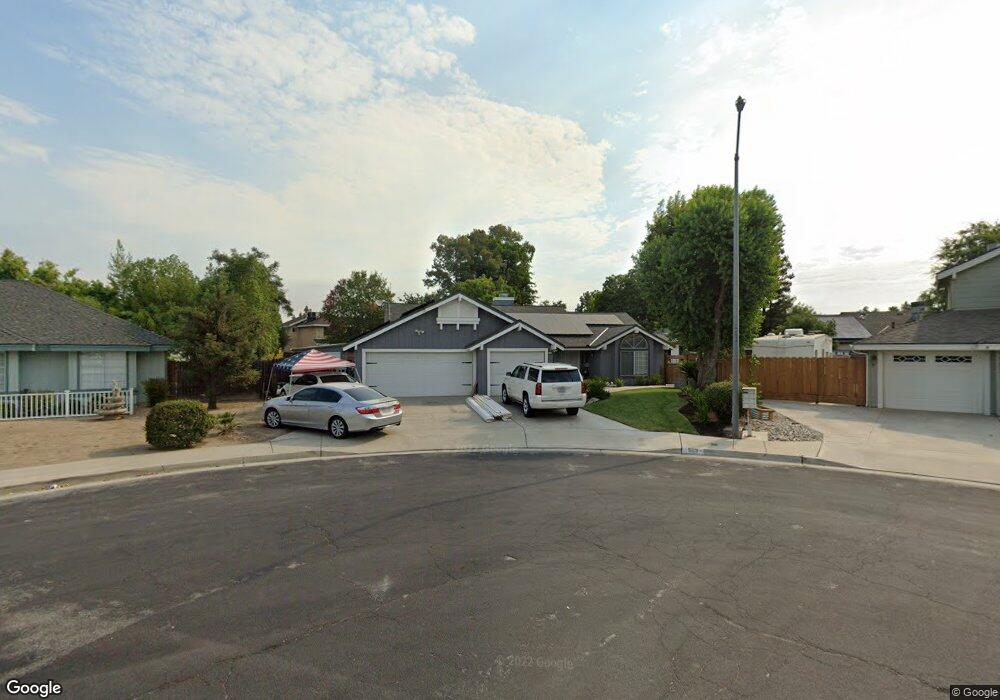
523 W Chennault Ave Clovis, CA 93611
Estimated Value: $509,341 - $567,000
3
Beds
2
Baths
1,762
Sq Ft
$307/Sq Ft
Est. Value
About This Home
This home is located at 523 W Chennault Ave, Clovis, CA 93611 and is currently estimated at $540,835, approximately $306 per square foot. 523 W Chennault Ave is a home located in Fresno County with nearby schools including Garfield Elementary School, Alta Sierra Intermediate School, and Buchanan High School.
Ownership History
Date
Name
Owned For
Owner Type
Purchase Details
Closed on
Jun 20, 2017
Sold by
Machado Sarah
Bought by
Carbajal Pedro
Current Estimated Value
Home Financials for this Owner
Home Financials are based on the most recent Mortgage that was taken out on this home.
Original Mortgage
$321,099
Outstanding Balance
$266,131
Interest Rate
3.89%
Mortgage Type
New Conventional
Estimated Equity
$274,704
Purchase Details
Closed on
Oct 23, 2013
Sold by
Machado Scott and Machado Sarah
Bought by
Machado Sarah
Purchase Details
Closed on
Jan 28, 2010
Sold by
Colburn Christopher L
Bought by
Machado Scott and Machado Sarah
Home Financials for this Owner
Home Financials are based on the most recent Mortgage that was taken out on this home.
Original Mortgage
$182,400
Interest Rate
5.03%
Mortgage Type
New Conventional
Purchase Details
Closed on
Sep 18, 2000
Sold by
Colburn Dawnalice G
Bought by
Colburn Christopher L
Create a Home Valuation Report for This Property
The Home Valuation Report is an in-depth analysis detailing your home's value as well as a comparison with similar homes in the area
Home Values in the Area
Average Home Value in this Area
Purchase History
| Date | Buyer | Sale Price | Title Company |
|---|---|---|---|
| Carbajal Pedro | $338,000 | Chicago Title Fresno | |
| Machado Sarah | -- | None Available | |
| Machado Scott | $228,000 | Fidelity National Title Co | |
| Colburn Christopher L | -- | -- |
Source: Public Records
Mortgage History
| Date | Status | Borrower | Loan Amount |
|---|---|---|---|
| Open | Carbajal Pedro | $321,099 | |
| Previous Owner | Machado Scott | $182,400 |
Source: Public Records
Tax History
| Year | Tax Paid | Tax Assessment Tax Assessment Total Assessment is a certain percentage of the fair market value that is determined by local assessors to be the total taxable value of land and additions on the property. | Land | Improvement |
|---|---|---|---|---|
| 2025 | $4,534 | $384,010 | $115,145 | $268,865 |
| 2023 | $4,362 | $369,101 | $110,675 | $258,426 |
| 2022 | $4,304 | $361,864 | $108,505 | $253,359 |
| 2021 | $4,183 | $354,770 | $106,378 | $248,392 |
| 2020 | $4,168 | $351,134 | $105,288 | $245,846 |
| 2019 | $4,087 | $344,250 | $103,224 | $241,026 |
| 2018 | $3,997 | $337,500 | $101,200 | $236,300 |
| 2017 | $3,016 | $253,583 | $63,396 | $190,187 |
| 2016 | $2,872 | $245,000 | $100,000 | $145,000 |
| 2015 | $2,815 | $240,200 | $64,000 | $176,200 |
| 2014 | $2,641 | $225,000 | $60,000 | $165,000 |
Source: Public Records
Map
Nearby Homes
- 450 W Alluvial Ave
- 484 W Balsam Ln
- 684 W Chennault Ave
- 602 W Mahogany Ln
- 2991 E Cromwell Ave
- 351 N Peach Ave
- 2873 E El Paso Ave
- 2740 E El Paso Ave
- 2845 E Goshen Ave
- 2669 E Sean Ave
- 2658 E Alluvial Ave Unit 120
- 2658 E Alluvial Ave Unit 220
- 2625 E Sean Ave
- 131 N Terry Ave
- 166 Bedford Ave
- 566 W Enterprise Ave
- 2549 E Jenny Ave
- 649 W Enterprise Ave
- 563 W Omaha Ave
- 7634 N Dearing Ave
- 533 W Chennault Ave
- 514 W Chennault Ave
- 522 W Minarets Ave
- 740 N Terry Ave
- 730 N Terry Ave
- 532 W Minarets Ave
- 750 N Terry Ave
- 500 W Chennault Ave
- 534 W Chennault Ave
- 553 W Chennault Ave
- 552 W Minarets Ave
- 485 W Kelly Ave
- 485 W Kelly Ave
- 735 N Terry Ave
- 521 W Minarets Ave
- 525 Sylmar Ct
- 531 W Minarets Ave
- 511 W Minarets Ave
- 745 N Terry Ave
- 480 W Chennault Ave
Your Personal Tour Guide
Ask me questions while you tour the home.