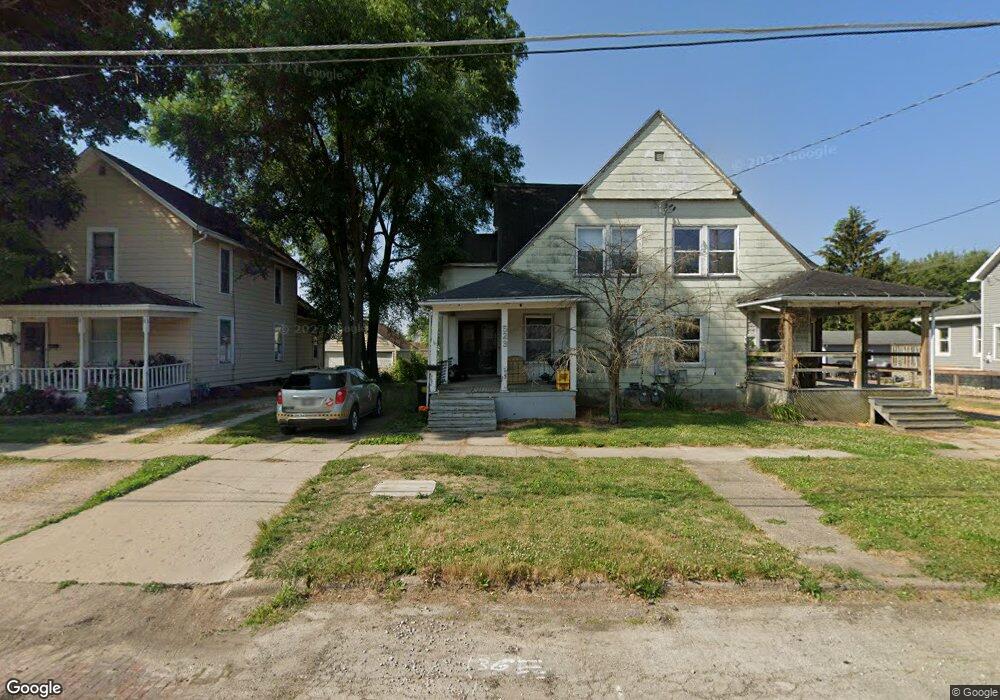
523 W Main St Unit 525 Morrison, IL 61270
Estimated Value: $54,028 - $96,000
Studio
--
Bath
4,580
Sq Ft
$17/Sq Ft
Est. Value
About This Home
This home is located at 523 W Main St Unit 525, Morrison, IL 61270 and is currently estimated at $79,257, approximately $17 per square foot. 523 W Main St Unit 525 is a home located in Whiteside County with nearby schools including Northside School, Southside School, and Morrison Junior High School.
Create a Home Valuation Report for This Property
The Home Valuation Report is an in-depth analysis detailing your home's value as well as a comparison with similar homes in the area
Home Values in the Area
Average Home Value in this Area
Tax History
| Year | Tax Paid | Tax Assessment Tax Assessment Total Assessment is a certain percentage of the fair market value that is determined by local assessors to be the total taxable value of land and additions on the property. | Land | Improvement |
|---|---|---|---|---|
| 2024 | $1,118 | $13,710 | $1,804 | $11,906 |
| 2023 | $1,042 | $12,481 | $1,642 | $10,839 |
| 2022 | $979 | $11,591 | $1,525 | $10,066 |
| 2021 | $954 | $11,350 | $1,493 | $9,857 |
| 2020 | $972 | $11,565 | $1,521 | $10,044 |
| 2019 | $883 | $10,411 | $1,974 | $8,437 |
| 2018 | $918 | $10,364 | $1,965 | $8,399 |
| 2017 | $852 | $9,956 | $1,888 | $8,068 |
| 2016 | $819 | $9,603 | $1,821 | $7,782 |
| 2015 | $858 | $9,838 | $1,866 | $7,972 |
| 2014 | $853 | $9,727 | $1,845 | $7,882 |
| 2013 | $858 | $9,838 | $1,866 | $7,972 |
Source: Public Records
Map
Nearby Homes
- 617 W Lincolnway
- 624 W Lincolnway
- 402 W Lincolnway
- 306 S Heaton St
- 604 Hillandale Ct
- 411 W Park St
- 814 W Park St
- 301 S Genesee St
- 105 E Knox St
- 308 S Genesee St
- 109 E Morris St
- 406 S Genesee St
- 304 S Madison St
- 208 Johnson St
- 302 E Park St
- 509 S Madison St
- 400 E Knox St
- 13629 Garden Plain Rd
- 503 E Main St
- 418 E Wall St
- 521 W Main St
- 527 W Main St
- 517 W Main St
- 515 W Main St
- 518 W Main St
- 516 W Main St
- 103 N Heaton St
- 513 W Main St
- 607 W Lincolnway
- 523 W Lincolnway
- 525 W Main St
- 514 W Main St
- 609 W Lincolnway Unit 1
- 609 W Lincolnway
- 609 W Lincolnway Unit Street
- 515 W Lincolnway
- 511 W Main St
- 615 W Lincolnway
- 615 W Lincolnway Way
- 513 W Lincolnway
Your Personal Tour Guide
Ask me questions while you tour the home.