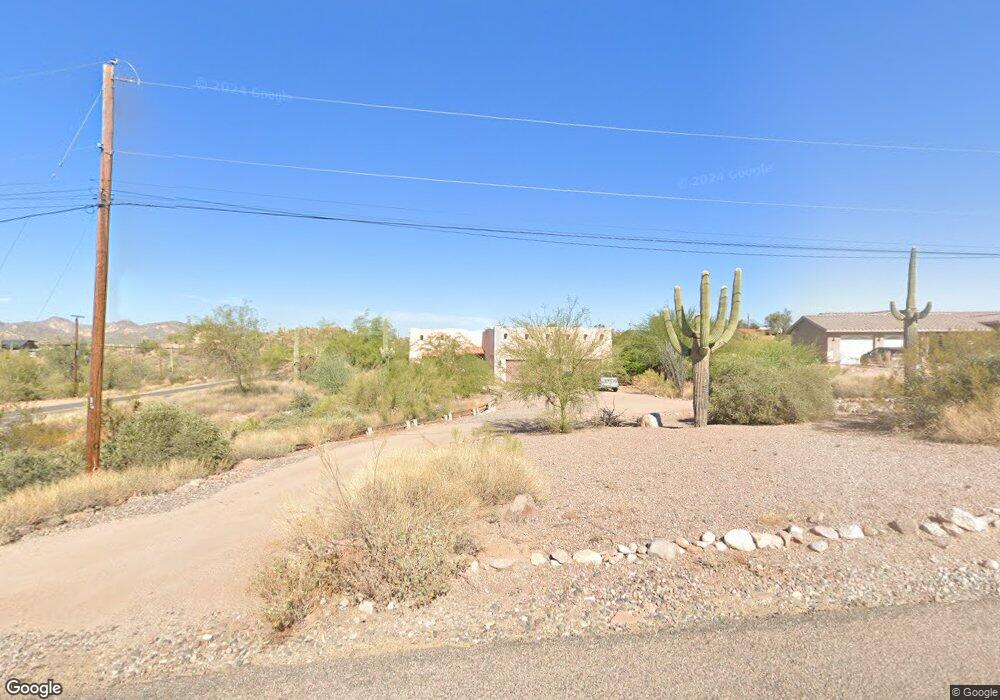
5230 E Boulder St Apache Junction, AZ 85119
Estimated Value: $635,459 - $922,000
Studio
--
Bath
1,871
Sq Ft
$416/Sq Ft
Est. Value
About This Home
This home is located at 5230 E Boulder St, Apache Junction, AZ 85119 and is currently estimated at $777,865, approximately $415 per square foot. 5230 E Boulder St is a home located in Pinal County with nearby schools including Desert Vista Elementary School, Cactus Canyon Junior High School, and Apache Junction High School.
Ownership History
Date
Name
Owned For
Owner Type
Purchase Details
Closed on
Dec 28, 2009
Sold by
Beneke Althea S
Bought by
Beneke Leslie W
Current Estimated Value
Purchase Details
Closed on
Jul 8, 2009
Sold by
Nahkala Scott K and Nabkala Beth A
Bought by
Beneke Leslie W and Beneke Althea Savage
Purchase Details
Closed on
Aug 22, 2007
Sold by
Garcia Andrea E
Bought by
Nahkala Scott K and Nahkala Beth A
Purchase Details
Closed on
Jul 25, 2005
Sold by
Jagr Custom Homes Llc
Bought by
Garcia Andrea E
Purchase Details
Closed on
Jan 17, 2005
Sold by
Toth Ann
Bought by
Jagr Custom Homes Llc
Create a Home Valuation Report for This Property
The Home Valuation Report is an in-depth analysis detailing your home's value as well as a comparison with similar homes in the area
Home Values in the Area
Average Home Value in this Area
Purchase History
| Date | Buyer | Sale Price | Title Company |
|---|---|---|---|
| Beneke Leslie W | -- | None Available | |
| Beneke Leslie W | $308,000 | Title Security Agency Of Pin | |
| Nahkala Scott K | $51,000 | Fidelity National Title Agen | |
| Nahkala Scott K | $399,000 | Fidelity National Title Agen | |
| Garcia Andrea E | $380,000 | Lawyers Title Ins | |
| Jagr Custom Homes Llc | $160,000 | Sunstate Title Agency Llc |
Source: Public Records
Tax History
| Year | Tax Paid | Tax Assessment Tax Assessment Total Assessment is a certain percentage of the fair market value that is determined by local assessors to be the total taxable value of land and additions on the property. | Land | Improvement |
|---|---|---|---|---|
| 2025 | $2,976 | $49,746 | -- | -- |
| 2024 | $2,796 | $46,941 | -- | -- |
| 2023 | $2,928 | $38,681 | $11,663 | $27,018 |
| 2022 | $2,796 | $31,953 | $7,632 | $24,321 |
| 2021 | $2,885 | $28,887 | $0 | $0 |
| 2020 | $2,813 | $26,794 | $0 | $0 |
| 2019 | $2,692 | $25,424 | $0 | $0 |
| 2018 | $2,633 | $24,287 | $0 | $0 |
| 2017 | $2,567 | $26,084 | $0 | $0 |
| 2016 | $2,488 | $24,961 | $5,582 | $19,379 |
| 2014 | $2,389 | $15,659 | $4,010 | $11,650 |
Source: Public Records
Map
Nearby Homes
- 0 E Boulder St Lot B --
- 0 E Boulder Lot A St Unit 6900708
- 0 E Boulder St D --
- 0 E Boulder St Lot C --
- 5063 E Reavis St
- 62XX E Reavis St
- 2652 S Prospector Point Rd
- 3086 N Herrala Way
- 2635 N Prospectors Rd
- 2030 N Don Peralta Rd
- 5850 E Concho St
- 4979 E Pioneer St
- 3700 E Hwy88 -- Unit 4
- 3826 N Rain Cloud Dr
- 1532 N Roadrunner Rd
- 4924 E Roundup St Unit 1 (A)
- 1165 N Mountain View Rd
- 5029 E Roundup St
- 945 N Mountain View Rd
- 5130 E Superstition Blvd
- 5286 E Boulder St
- 5286 E Boulder St
- 5286 E Boulder St
- 3100 N Val Vista Rd Unit C
- 0000 E Boulder St E
- 5382 E Boulder St
- 3151 N Val Vista Rd
- 2984 N Val Vista Rd
- 5301 E Singletree St
- 5325 E Boulder St Unit ID1247584P
- 5325 E Boulder St
- 5337 E Singletree St
- 3070 N Val Vista Rd
- 5394 E Boulder St
- 5700+ E Boulder St
- 0 E Boulder St Unit 4023822
- 5700+ E Boulder St
- 5900+- E Boulder St
- 5375 E Boulder St
- 5195 E Singletree St
Your Personal Tour Guide
Ask me questions while you tour the home.