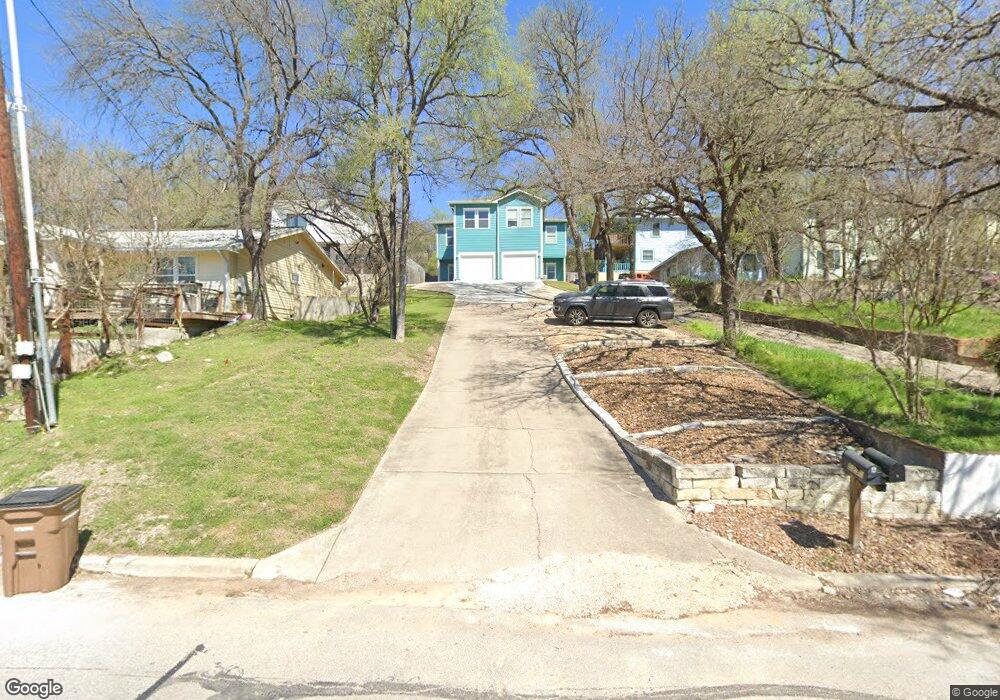
5230 Ledesma Rd Unit A/B Austin, TX 78721
East MLK NeighborhoodEstimated Value: $494,000 - $945,000
Studio
5
Baths
2,776
Sq Ft
$240/Sq Ft
Est. Value
About This Home
This home is located at 5230 Ledesma Rd Unit A/B, Austin, TX 78721 and is currently estimated at $666,259, approximately $240 per square foot. 5230 Ledesma Rd Unit A/B is a home located in Travis County with nearby schools including Ortega Elementary School, Martin Middle School, and Eastside Early College High School.
Ownership History
Date
Name
Owned For
Owner Type
Purchase Details
Closed on
Apr 28, 2015
Sold by
Burgess Norwin D and Burgess Keisha K
Bought by
Lindsay Kathryn M and Buster Tom
Current Estimated Value
Home Financials for this Owner
Home Financials are based on the most recent Mortgage that was taken out on this home.
Original Mortgage
$245,250
Outstanding Balance
$190,022
Interest Rate
3.84%
Mortgage Type
New Conventional
Estimated Equity
$476,237
Purchase Details
Closed on
Jul 26, 2007
Sold by
Burgess Norwin D
Bought by
Burgess Norwin D and Burgess Keisha K
Purchase Details
Closed on
Apr 27, 2006
Sold by
Tolley Mark F
Bought by
Burgess Norwin D
Home Financials for this Owner
Home Financials are based on the most recent Mortgage that was taken out on this home.
Original Mortgage
$216,000
Interest Rate
6.32%
Mortgage Type
Construction
Purchase Details
Closed on
Aug 30, 2005
Sold by
Lewis Willie Clyde and Lewis Willie C
Bought by
Tolley Mark F
Create a Home Valuation Report for This Property
The Home Valuation Report is an in-depth analysis detailing your home's value as well as a comparison with similar homes in the area
Home Values in the Area
Average Home Value in this Area
Purchase History
| Date | Buyer | Sale Price | Title Company |
|---|---|---|---|
| Lindsay Kathryn M | -- | None Available | |
| Burgess Norwin D | -- | Itc | |
| Burgess Norwin D | -- | Gracy Title Company | |
| Tolley Mark F | -- | Gracy Title Co |
Source: Public Records
Mortgage History
| Date | Status | Borrower | Loan Amount |
|---|---|---|---|
| Open | Lindsay Kathryn M | $245,250 | |
| Previous Owner | Burgess Norwin D | $216,000 | |
| Closed | Burgess Norwin D | $0 |
Source: Public Records
Tax History
| Year | Tax Paid | Tax Assessment Tax Assessment Total Assessment is a certain percentage of the fair market value that is determined by local assessors to be the total taxable value of land and additions on the property. | Land | Improvement |
|---|---|---|---|---|
| 2025 | $11,408 | $557,422 | $285,642 | $271,780 |
| 2023 | $11,831 | $653,903 | $330,000 | $323,903 |
| 2022 | $14,812 | $750,000 | $330,000 | $420,000 |
| 2021 | $10,868 | $499,278 | $192,500 | $306,778 |
| 2020 | $8,706 | $405,900 | $192,500 | $213,400 |
| 2018 | $7,322 | $330,733 | $192,500 | $138,233 |
| 2017 | $7,912 | $354,793 | $154,000 | $200,793 |
| 2016 | $7,094 | $318,093 | $82,500 | $235,593 |
| 2015 | $5,021 | $279,508 | $82,500 | $197,008 |
| 2014 | $5,021 | $210,992 | $66,000 | $144,992 |
Source: Public Records
Map
Nearby Homes
- 5227 Ledesma Rd
- 5305 Ledesma Rd Unit 4
- 5307 Ledesma Rd
- 1106 Lott Ave
- 5239 Ledesma Rd
- 5231 Ledesma Rd
- 5235 Ledesma Rd
- 1137 Richardine Ave
- 1120 Omega Ave Unit 1
- 4803 Lott Ave
- 000 Lott Ave
- 1004 Lott Ave
- 1114 Eleanor St
- 1110 Christie Dr
- 5002 Ledesma Rd
- 1134 Lott Ave
- 1114 Richardine Ave
- 5405 Prock Ln
- 1105 Richardine Ave
- 5309 Prock Ln
- 5230 Ledesma Rd Unit A
- 5230 Ledesma Rd Unit B
- 5230 Ledesma Rd
- 5230 Ledesma Rd
- 5232 Ledesma Rd
- 5228 Ledesma Rd
- 5234 Ledesma Rd
- 5300 Ledesma Rd Unit A/B
- 5300 Ledesma Rd Unit B
- 5300 Ledesma Rd Unit A
- 5300 Ledesma Rd
- 1106 Lott Ave Unit E
- 5302 Ledesma Rd
- 5243 Ledesma Rd
- 5222 Ledesma Rd
- 5304 Ledesma Rd
- 5306 Ledesma Rd
- 5216 Ledesma Rd
- 5303 Ledesma Rd
- 5224 Ledesma Rd
Your Personal Tour Guide
Ask me questions while you tour the home.