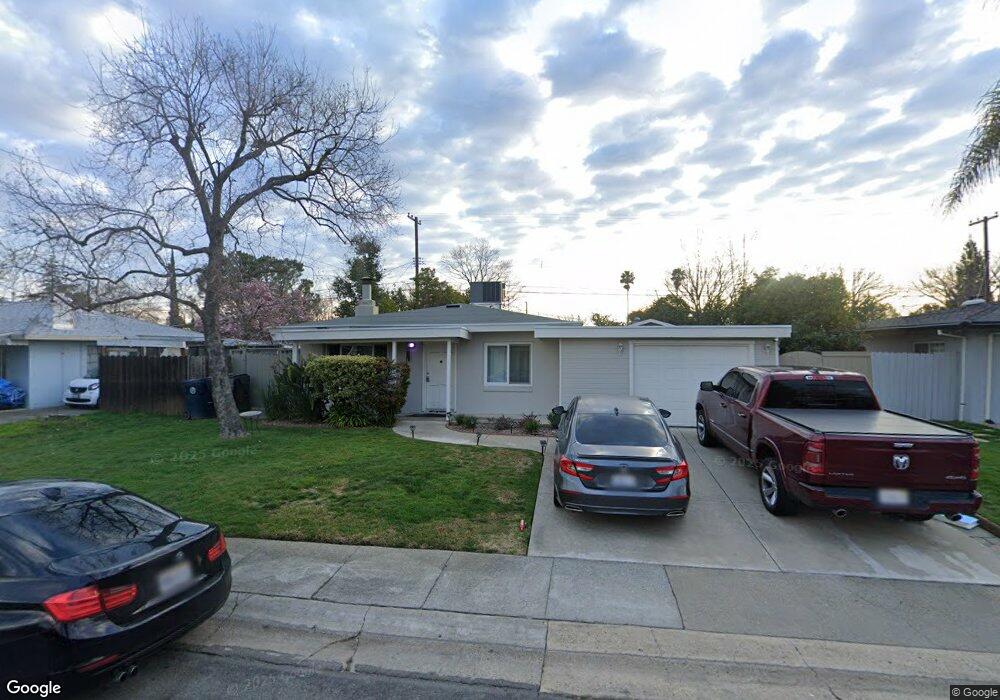
5231 Cabrillo Way Sacramento, CA 95820
Tallac Village NeighborhoodEstimated Value: $288,000 - $408,000
3
Beds
1
Bath
1,039
Sq Ft
$339/Sq Ft
Est. Value
About This Home
This home is located at 5231 Cabrillo Way, Sacramento, CA 95820 and is currently estimated at $352,490, approximately $339 per square foot. 5231 Cabrillo Way is a home located in Sacramento County with nearby schools including Mark Twain Elementary School, Umoja International Academy, and Hiram W. Johnson High School.
Ownership History
Date
Name
Owned For
Owner Type
Purchase Details
Closed on
Mar 28, 2012
Sold by
Lang Michael V and Lang Jamie L
Bought by
Lang Michael Vernon and Lang Jamie Louise
Current Estimated Value
Purchase Details
Closed on
Feb 17, 2010
Sold by
Federal Home Loan Mortgage Corporation
Bought by
Lang Michael V and Lang Jamie L
Purchase Details
Closed on
Dec 2, 2009
Sold by
Chan Peter F
Bought by
Federal Home Loan Mortgage Corporation
Purchase Details
Closed on
Jan 12, 2001
Sold by
Woodbury Family Living Trust and Worthey Wilfred
Bought by
Chan Peter F
Home Financials for this Owner
Home Financials are based on the most recent Mortgage that was taken out on this home.
Original Mortgage
$77,200
Interest Rate
7.41%
Purchase Details
Closed on
Apr 20, 2000
Sold by
Woodbury Family Living Trust and Worthey Wilfred
Bought by
Woodbury Wilfred Worthey and Woodbury Family Trust
Create a Home Valuation Report for This Property
The Home Valuation Report is an in-depth analysis detailing your home's value as well as a comparison with similar homes in the area
Home Values in the Area
Average Home Value in this Area
Purchase History
| Date | Buyer | Sale Price | Title Company |
|---|---|---|---|
| Lang Michael Vernon | -- | None Available | |
| Lang Michael V | $108,000 | First American Title | |
| Federal Home Loan Mortgage Corporation | $107,500 | None Available | |
| Chan Peter F | $97,000 | Commonwealth Land Title Co | |
| Woodbury Wilfred Worthey | -- | -- |
Source: Public Records
Mortgage History
| Date | Status | Borrower | Loan Amount |
|---|---|---|---|
| Previous Owner | Chan Peter F | $77,200 |
Source: Public Records
Tax History Compared to Growth
Tax History
| Year | Tax Paid | Tax Assessment Tax Assessment Total Assessment is a certain percentage of the fair market value that is determined by local assessors to be the total taxable value of land and additions on the property. | Land | Improvement |
|---|---|---|---|---|
| 2025 | $1,765 | $139,394 | $51,627 | $87,767 |
| 2024 | $1,765 | $136,662 | $50,615 | $86,047 |
| 2023 | $1,723 | $133,983 | $49,623 | $84,360 |
| 2022 | $1,693 | $131,356 | $48,650 | $82,706 |
| 2021 | $1,615 | $128,782 | $47,697 | $81,085 |
| 2020 | $1,624 | $127,462 | $47,208 | $80,254 |
| 2019 | $1,591 | $124,964 | $46,283 | $78,681 |
| 2018 | $1,549 | $122,515 | $45,376 | $77,139 |
| 2017 | $1,527 | $120,114 | $44,487 | $75,627 |
| 2016 | $1,471 | $117,760 | $43,615 | $74,145 |
| 2015 | $1,448 | $115,992 | $42,960 | $73,032 |
| 2014 | $1,411 | $113,721 | $42,119 | $71,602 |
Source: Public Records
Map
Nearby Homes
- 5241 Cabrillo Way
- 5221 Cabrillo Way
- 5206 61st St
- 5251 Cabrillo Way
- 5230 Cabrillo Way
- 5220 Cabrillo Way
- 5240 Cabrillo Way
- 5214 61st St
- 5141 Cabrillo Way
- 5212 Cabrillo Way
- 5301 Cabrillo Way
- 5140 61st St
- 5300 61st St
- 5200 Cabrillo Way
- 5300 Cabrillo Way
- 5231 60th St
- 5205 61st St
- 5131 Cabrillo Way
- 5241 60th St
- 5221 60th St