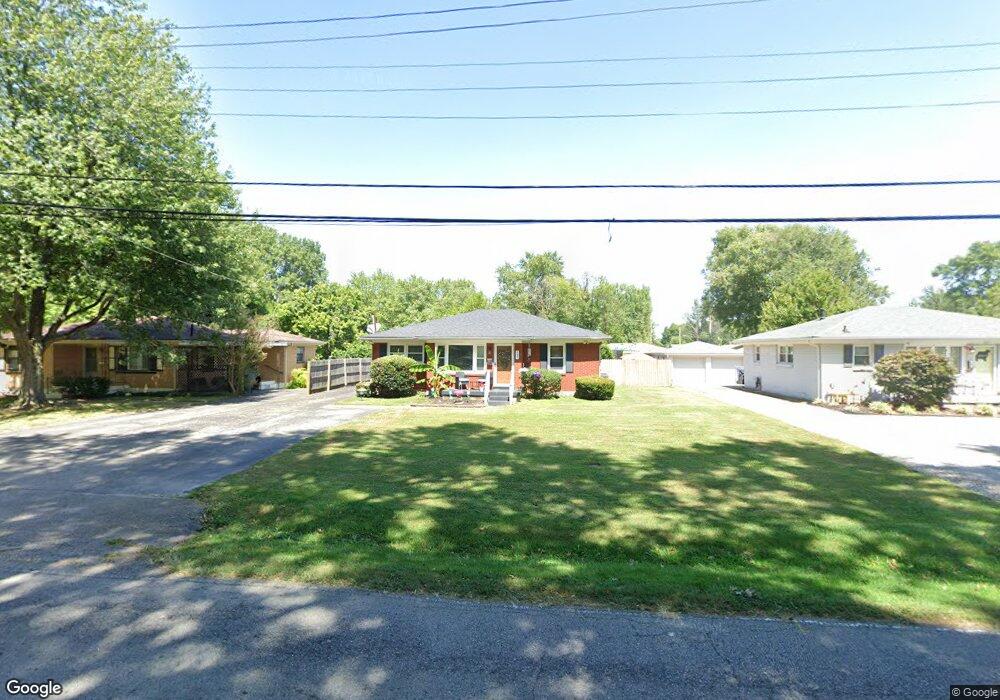
5231 Maryman Rd Louisville, KY 40258
Pleasure Ridge Park NeighborhoodEstimated Value: $233,000 - $285,000
2
Beds
4
Baths
1,613
Sq Ft
$155/Sq Ft
Est. Value
About This Home
This home is located at 5231 Maryman Rd, Louisville, KY 40258 and is currently estimated at $249,781, approximately $154 per square foot. 5231 Maryman Rd is a home located in Jefferson County with nearby schools including Shacklette Elementary School, Wilkerson Elementary School, and Sanders Elementary School.
Ownership History
Date
Name
Owned For
Owner Type
Purchase Details
Closed on
Aug 1, 2017
Sold by
Woodard Christopher M
Bought by
Woodard Krystal E
Current Estimated Value
Home Financials for this Owner
Home Financials are based on the most recent Mortgage that was taken out on this home.
Original Mortgage
$119,010
Outstanding Balance
$99,492
Interest Rate
4.03%
Mortgage Type
FHA
Estimated Equity
$150,289
Purchase Details
Closed on
Jun 10, 2010
Sold by
Woodard Krystal E and Woodard Christopher M
Bought by
Woodard Krystal E and Woodard Christopher M
Home Financials for this Owner
Home Financials are based on the most recent Mortgage that was taken out on this home.
Original Mortgage
$131,902
Interest Rate
4.83%
Mortgage Type
FHA
Purchase Details
Closed on
Sep 17, 2007
Sold by
England Hope and England Carolyn H
Bought by
Cotton Krystal E
Home Financials for this Owner
Home Financials are based on the most recent Mortgage that was taken out on this home.
Original Mortgage
$127,991
Interest Rate
6.62%
Mortgage Type
FHA
Create a Home Valuation Report for This Property
The Home Valuation Report is an in-depth analysis detailing your home's value as well as a comparison with similar homes in the area
Home Values in the Area
Average Home Value in this Area
Purchase History
| Date | Buyer | Sale Price | Title Company |
|---|---|---|---|
| Woodard Krystal E | -- | Vantage Point Title | |
| Woodard Krystal E | -- | Landsel Title | |
| Cotton Krystal E | $130,000 | None Available |
Source: Public Records
Mortgage History
| Date | Status | Borrower | Loan Amount |
|---|---|---|---|
| Open | Woodard Krystal E | $119,010 | |
| Closed | Woodard Krystal E | $131,902 | |
| Closed | Cotton Krystal E | $127,991 |
Source: Public Records
Tax History Compared to Growth
Tax History
| Year | Tax Paid | Tax Assessment Tax Assessment Total Assessment is a certain percentage of the fair market value that is determined by local assessors to be the total taxable value of land and additions on the property. | Land | Improvement |
|---|---|---|---|---|
| 2024 | $2,373 | $203,650 | $18,000 | $185,650 |
| 2023 | $2,440 | $203,650 | $18,000 | $185,650 |
| 2022 | $1,592 | $132,430 | $20,000 | $112,430 |
| 2021 | $1,715 | $132,430 | $20,000 | $112,430 |
| 2020 | $1,532 | $132,430 | $20,000 | $112,430 |
| 2019 | $1,501 | $132,430 | $20,000 | $112,430 |
| 2018 | $1,394 | $124,380 | $17,500 | $106,880 |
| 2017 | $1,305 | $124,380 | $17,500 | $106,880 |
| 2013 | $1,244 | $124,380 | $17,500 | $106,880 |
Source: Public Records
Map
Nearby Homes
- 5215 Pyrus Ln
- 5202 Rodgers Rd
- 5406 Trefoil Ln
- 8108 Nancy Ln
- 8208 Kerry Rd
- 5513 Tamarack Ln
- 5212 W Pages Ln
- 5605 Tamarack Ln
- 5007 Lila Ave
- 8501 Sally Dr
- 7906 Daffodil Dr
- 5604 W Pages Ln
- 7807 Axtell Ave
- 8548 Vicki Ln
- 8108 Poinsettia Dr
- 5213 Stephan Dr
- 4824 Cofer Ave
- 7801 Mango Dr
- 7711 Bramble Ln
- 5625 David Ln
- 5215 Maryman Rd
- 5241 Maryman Rd
- 5206 Dogwood Dr
- 5253 Maryman Rd
- 5199 Maryman Rd
- 5208 Dogwood Dr
- 8102 N Blake Ln
- 5230 Maryman Rd
- 5214 Maryman Rd
- 5240 Maryman Rd
- 5210 Dogwood Dr
- 5200 Maryman Rd
- 5252 Maryman Rd
- 5275 Maryman Rd
- 8121 Entrance Rd
- 8112 Blake Ln
- 5165 Maryman Rd
- 5209 Dogwood Dr
- 8101 N Blake Ln
- 8015 Conifer Dr