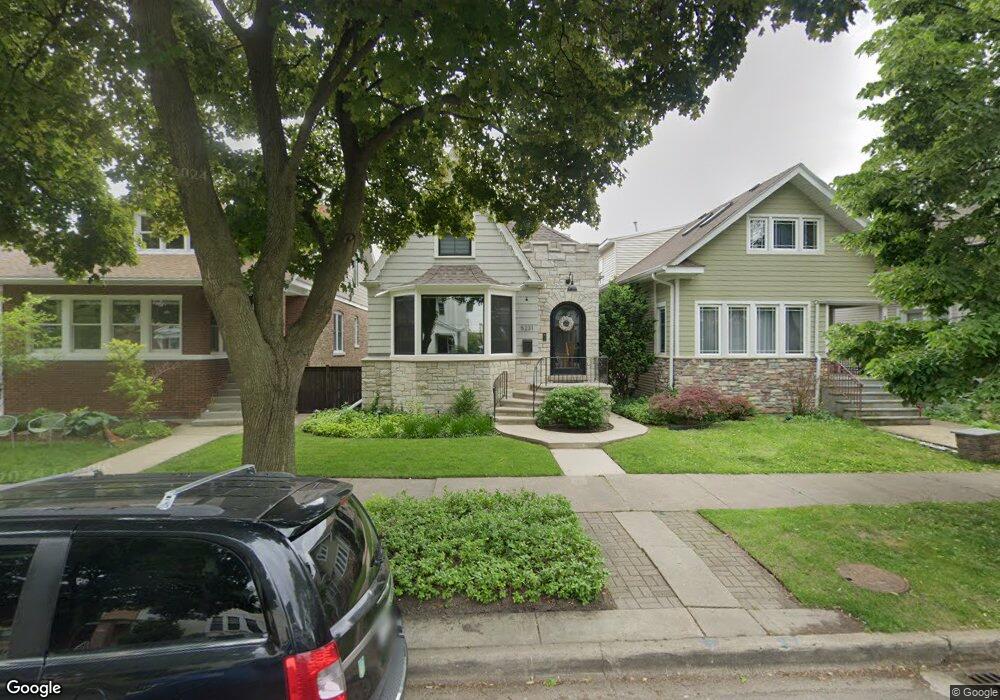
5231 W Berteau Ave Chicago, IL 60641
Portage Park NeighborhoodEstimated Value: $458,122 - $553,000
4
Beds
2
Baths
1,885
Sq Ft
$259/Sq Ft
Est. Value
About This Home
This home is located at 5231 W Berteau Ave, Chicago, IL 60641 and is currently estimated at $487,781, approximately $258 per square foot. 5231 W Berteau Ave is a home located in Cook County with nearby schools including Portage Park Elementary School, Schurz High School, and St John Lutheran School.
Ownership History
Date
Name
Owned For
Owner Type
Purchase Details
Closed on
Apr 17, 2018
Sold by
Foster Loretta M and Foster Gregory J
Bought by
Foster Gregory J and Foster Loretta M
Current Estimated Value
Purchase Details
Closed on
Aug 20, 2003
Sold by
Foser Bedford F and Foster Bedford F
Bought by
Foster Loretta M and Foster Gregory J
Home Financials for this Owner
Home Financials are based on the most recent Mortgage that was taken out on this home.
Original Mortgage
$226,000
Interest Rate
6.4%
Mortgage Type
Balloon
Purchase Details
Closed on
Mar 27, 1997
Sold by
Craig James M
Bought by
Foster Bedford F
Home Financials for this Owner
Home Financials are based on the most recent Mortgage that was taken out on this home.
Original Mortgage
$126,000
Interest Rate
7.65%
Purchase Details
Closed on
Oct 8, 1993
Sold by
Craig James M and Craig Irma R
Bought by
Craig James M and Craig Irma R
Home Financials for this Owner
Home Financials are based on the most recent Mortgage that was taken out on this home.
Original Mortgage
$129,265
Interest Rate
7%
Mortgage Type
FHA
Create a Home Valuation Report for This Property
The Home Valuation Report is an in-depth analysis detailing your home's value as well as a comparison with similar homes in the area
Home Values in the Area
Average Home Value in this Area
Purchase History
| Date | Buyer | Sale Price | Title Company |
|---|---|---|---|
| Foster Gregory J | -- | None Available | |
| Foster Loretta M | -- | Law Title | |
| Foster Bedford F | $140,000 | Plm Title Company | |
| Craig James M | -- | -- |
Source: Public Records
Mortgage History
| Date | Status | Borrower | Loan Amount |
|---|---|---|---|
| Closed | Foster Loretta M | $226,000 | |
| Closed | Foster Bedford F | $126,000 | |
| Previous Owner | Craig James M | $129,265 |
Source: Public Records
Tax History Compared to Growth
Tax History
| Year | Tax Paid | Tax Assessment Tax Assessment Total Assessment is a certain percentage of the fair market value that is determined by local assessors to be the total taxable value of land and additions on the property. | Land | Improvement |
|---|---|---|---|---|
| 2024 | $6,684 | $47,000 | $13,125 | $33,875 |
| 2023 | $7,014 | $36,379 | $10,500 | $25,879 |
| 2022 | $7,014 | $38,907 | $10,500 | $28,407 |
| 2021 | $6,875 | $37,521 | $10,500 | $27,021 |
| 2020 | $6,135 | $30,642 | $5,437 | $25,205 |
| 2019 | $6,151 | $34,047 | $5,437 | $28,610 |
| 2018 | $6,047 | $34,047 | $5,437 | $28,610 |
| 2017 | $5,325 | $28,113 | $4,875 | $23,238 |
| 2016 | $5,131 | $28,113 | $4,875 | $23,238 |
| 2015 | $4,671 | $28,113 | $4,875 | $23,238 |
| 2014 | $4,510 | $26,874 | $4,500 | $22,374 |
| 2013 | $4,409 | $26,874 | $4,500 | $22,374 |
Source: Public Records
Map
Nearby Homes
- 5213 W Warner Ave
- 5253 W Cullom Ave
- 5255 W Belle Plaine Ave
- 5221 W Montrose Ave
- 5410 W Hutchinson St
- 4119 N Leclaire Ave
- 5401 W Montrose Ave
- 5354 W Montrose Ave
- 5036 W Pensacola Ave Unit 309
- 5141 W Dakin St
- 5062 W Agatite Ave Unit 3
- 5436 W Dakin St
- 5043 W Sunnyside Ave
- 5352 W Sunnyside Ave
- 5330 W Windsor Ave Unit 3I
- 4848 W Belle Plaine Ave Unit 2R
- 4501 N Lavergne Ave
- 4855 W Montrose Ave
- 5416 W Windsor Ave Unit 1N
- 5501 W Byron St
- 5235 W Berteau Ave
- 5227 W Berteau Ave
- 5237 W Berteau Ave
- 5225 W Berteau Ave
- 5241 W Berteau Ave
- 5221 W Berteau Ave
- 5243 W Berteau Ave
- 5219 W Berteau Ave
- 5230 W Warner Ave
- 5232 W Warner Ave
- 5226 W Warner Ave
- 5247 W Berteau Ave
- 5217 W Berteau Ave
- 5236 W Warner Ave
- 5224 W Warner Ave
- 5240 W Warner Ave
- 5220 W Warner Ave
- 5228 W Berteau Ave
- 5213 W Berteau Ave
- 5242 W Warner Ave