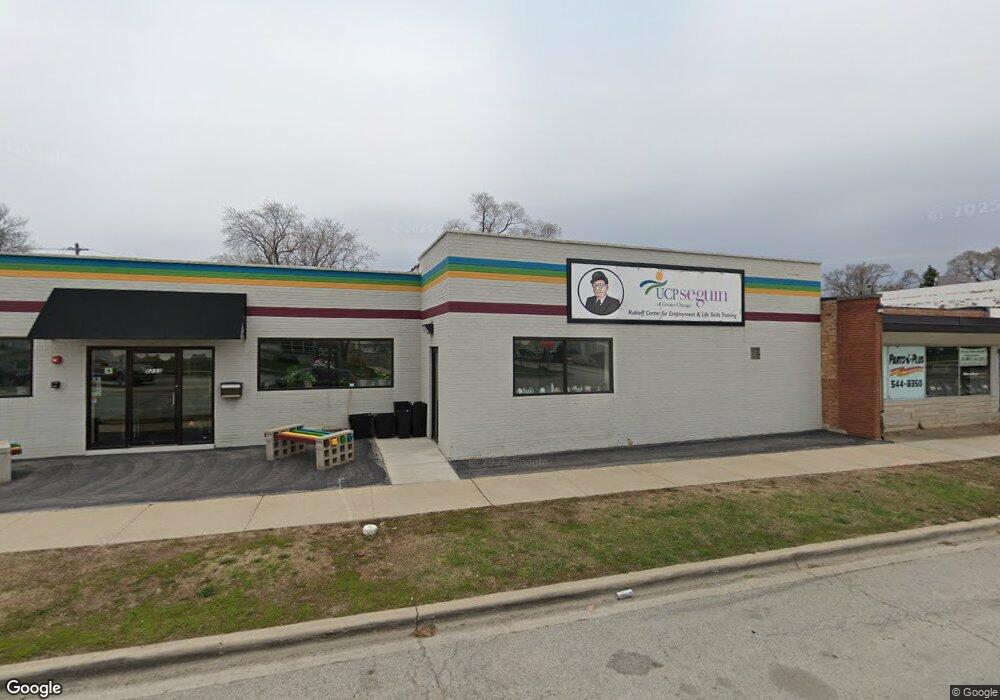
5233 Saint Charles Rd Berkeley, IL 60163
Estimated Value: $382,868
Studio
--
Bath
4,831
Sq Ft
$79/Sq Ft
Est. Value
About This Home
This home is located at 5233 Saint Charles Rd, Berkeley, IL 60163 and is currently estimated at $382,868, approximately $79 per square foot. 5233 Saint Charles Rd is a home located in Cook County with nearby schools including Macarthur Intermediate School, Sunnyside Elementary School, and Proviso West High School.
Ownership History
Date
Name
Owned For
Owner Type
Purchase Details
Closed on
Oct 20, 2016
Sold by
Huff Thomas W and Huff Barbara A
Bought by
United Cerebral Patsy Seguin
Current Estimated Value
Purchase Details
Closed on
Mar 7, 2007
Sold by
Nshe Tahoe Llc
Bought by
Huff Thomas W and Huff Barbara A
Purchase Details
Closed on
Sep 20, 2006
Sold by
Ortiz J Jesus and Ortiz Rita
Bought by
Nshe Tahoe Llc
Purchase Details
Closed on
Jan 5, 2003
Sold by
Goldberg Donald L
Bought by
Ortiz J Jesus and Ortiz Rita
Home Financials for this Owner
Home Financials are based on the most recent Mortgage that was taken out on this home.
Original Mortgage
$270,000
Interest Rate
5.94%
Mortgage Type
Commercial
Create a Home Valuation Report for This Property
The Home Valuation Report is an in-depth analysis detailing your home's value as well as a comparison with similar homes in the area
Home Values in the Area
Average Home Value in this Area
Purchase History
| Date | Buyer | Sale Price | Title Company |
|---|---|---|---|
| United Cerebral Patsy Seguin | $245,000 | Chicago Title Insurance Comp | |
| Huff Thomas W | $610,000 | None Available | |
| Nshe Tahoe Llc | $355,000 | Republic Title Company | |
| Ortiz J Jesus | $360,000 | -- |
Source: Public Records
Mortgage History
| Date | Status | Borrower | Loan Amount |
|---|---|---|---|
| Previous Owner | Ortiz J Jesus | $270,000 |
Source: Public Records
Tax History
| Year | Tax Paid | Tax Assessment Tax Assessment Total Assessment is a certain percentage of the fair market value that is determined by local assessors to be the total taxable value of land and additions on the property. | Land | Improvement |
|---|---|---|---|---|
| 2025 | $40,170 | -- | -- | -- |
| 2024 | $40,170 | -- | -- | -- |
| 2023 | $40,170 | -- | -- | -- |
| 2022 | $40,170 | -- | -- | -- |
| 2021 | $40,170 | $0 | $0 | $0 |
| 2020 | $40,170 | $0 | $0 | $0 |
| 2019 | $40,170 | $0 | $0 | $0 |
| 2018 | $0 | $0 | $0 | $0 |
| 2017 | $40,170 | $98,600 | $21,093 | $77,507 |
| 2016 | $13,944 | $33,568 | $19,921 | $13,647 |
| 2015 | $36,460 | $88,160 | $19,921 | $68,239 |
| 2014 | $35,804 | $88,160 | $19,921 | $68,239 |
| 2013 | $32,679 | $87,105 | $19,921 | $67,184 |
Source: Public Records
Map
Nearby Homes
- 1463 Speechley Blvd
- 768 N Rohde Ave
- 51 50th Ave
- 129 49th Ave
- 4904 W Hawthorne Ave
- 33 49th Ave
- 241 48th Ave
- 1529 N Hillside Ave
- 47 48th Ave
- 4938 W Randolph St
- 512 50th Ave
- 605 N Wolf Rd Unit B9
- 5700 Saint Charles Rd
- 31 46th Ave
- 5706 Saint Charles Rd
- 1447 N Ashbel Ave
- 1428 1/2 N Ashbel Ave
- 520 N Wolf Rd Unit 203
- 4530 Butterfield Rd
- 429 Geneva Ave
- 1412 N Rohde Ave
- 1416 N Rohde Ave
- 5245 St Charles Rd
- 1413 Morris Ave
- 5245 Saint Charles Rd
- 1420 N Rohde Ave
- 1423 Morris Ave
- 1422 N Rohde Ave
- 1425 Morris Ave
- 1415 N Rohde Ave
- 1426 N Rohde Ave
- 1427 Morris Ave
- 5211 Saint Charles Rd Unit GARDEN
- 5211 Saint Charles Rd Unit G
- 1419 N Rohde Ave
- 1428 N Rohde Ave
- 5301 Saint Charles Rd
- 5301 Saint Charles Rd Unit B
- 1421 N Rohde Ave
Your Personal Tour Guide
Ask me questions while you tour the home.