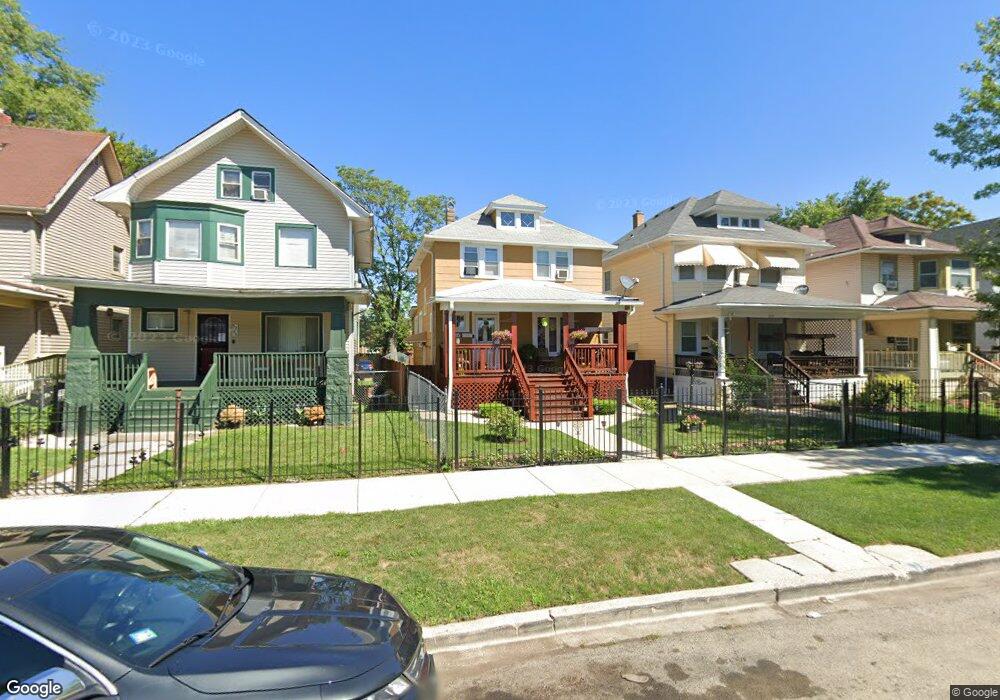
5234 W Monroe St Chicago, IL 60644
Austin NeighborhoodEstimated Value: $222,000 - $301,000
3
Beds
1
Bath
1,584
Sq Ft
$162/Sq Ft
Est. Value
About This Home
This home is located at 5234 W Monroe St, Chicago, IL 60644 and is currently estimated at $255,995, approximately $161 per square foot. 5234 W Monroe St is a home located in Cook County with nearby schools including Depriest Elementary School, KIPP Academy Chicago Campus, and Moving Everest Charter School.
Ownership History
Date
Name
Owned For
Owner Type
Purchase Details
Closed on
Jan 26, 2012
Sold by
Maury Lemar
Bought by
Anderson Golda M
Current Estimated Value
Purchase Details
Closed on
Jul 15, 2010
Sold by
Maury Sherrod
Bought by
Maury Lemar and Maury Michael
Purchase Details
Closed on
Mar 18, 2006
Sold by
Maury Lemar C
Bought by
Sherrod Maury Lemar and Sherrod Maury
Purchase Details
Closed on
Feb 4, 1997
Sold by
Banco Popular Illinois
Bought by
Cook Darlene White and White Deandre M
Home Financials for this Owner
Home Financials are based on the most recent Mortgage that was taken out on this home.
Original Mortgage
$99,182
Interest Rate
7.74%
Mortgage Type
FHA
Purchase Details
Closed on
Jul 25, 1995
Sold by
William Francis
Bought by
Williams Francis and Williams Dorothy Lee
Home Financials for this Owner
Home Financials are based on the most recent Mortgage that was taken out on this home.
Original Mortgage
$19,000
Interest Rate
7.64%
Create a Home Valuation Report for This Property
The Home Valuation Report is an in-depth analysis detailing your home's value as well as a comparison with similar homes in the area
Home Values in the Area
Average Home Value in this Area
Purchase History
| Date | Buyer | Sale Price | Title Company |
|---|---|---|---|
| Anderson Golda M | -- | None Available | |
| Maury Lemar | -- | None Available | |
| Sherrod Maury Lemar | -- | None Available | |
| Cook Darlene White | $99,000 | -- | |
| Williams Francis | -- | -- |
Source: Public Records
Mortgage History
| Date | Status | Borrower | Loan Amount |
|---|---|---|---|
| Previous Owner | Cook Darlene White | $99,182 | |
| Previous Owner | Williams Francis | $19,000 |
Source: Public Records
Tax History Compared to Growth
Tax History
| Year | Tax Paid | Tax Assessment Tax Assessment Total Assessment is a certain percentage of the fair market value that is determined by local assessors to be the total taxable value of land and additions on the property. | Land | Improvement |
|---|---|---|---|---|
| 2024 | $2,465 | $16,100 | $6,547 | $9,553 |
| 2023 | $2,382 | $15,000 | $5,320 | $9,680 |
| 2022 | $2,382 | $15,000 | $5,320 | $9,680 |
| 2021 | $2,346 | $14,999 | $5,319 | $9,680 |
| 2020 | $1,785 | $11,113 | $5,319 | $5,794 |
| 2019 | $1,792 | $12,348 | $5,319 | $7,029 |
| 2018 | $1,761 | $12,348 | $5,319 | $7,029 |
| 2017 | $1,815 | $11,806 | $4,705 | $7,101 |
| 2016 | $2,365 | $11,806 | $4,705 | $7,101 |
| 2015 | $2,163 | $11,806 | $4,705 | $7,101 |
| 2014 | $2,102 | $11,331 | $4,501 | $6,830 |
| 2013 | $2,061 | $11,331 | $4,501 | $6,830 |
Source: Public Records
Map
Nearby Homes
- 4607 W Madison St
- 1100 S Menard St
- 4855 W Jackson Blvd
- 37 N Lockwood Ave
- 5125 W Monroe St
- 5153 W Washington Blvd
- 5092 W Monroe St
- 5100 W Quincy St
- 5333 W Quincy St
- 38 N Long Ave
- 144 N Laramie Ave
- 163 N Lockwood Ave
- 5449 W Quincy St
- 174 N Leclaire Ave
- 206 N Lockwood Ave
- 206 N Leamington Ave
- 212 N Leamington Ave
- 5005 W West End Ave
- 4918 W Monroe St
- 220 N Lorel Ave
- 5232 W Monroe St
- 5238 W Monroe St
- 5228 W Monroe St
- 5242 W Monroe St
- 5226 W Monroe St
- 5222 W Monroe St
- 5248 W Monroe St
- 5252 W Monroe St
- 5218 W Monroe St
- 5225 W Madison St
- 5225 W Madison St Unit 53
- 5235 W Monroe St
- 5243 W Monroe St
- 5216 W Monroe St
- 5254 W Monroe St
- 5229 W Monroe St
- 5251 W Madison St
- 5219 W Madison St
- 5219 W Madison St Unit 2E
- 5245 W Monroe St