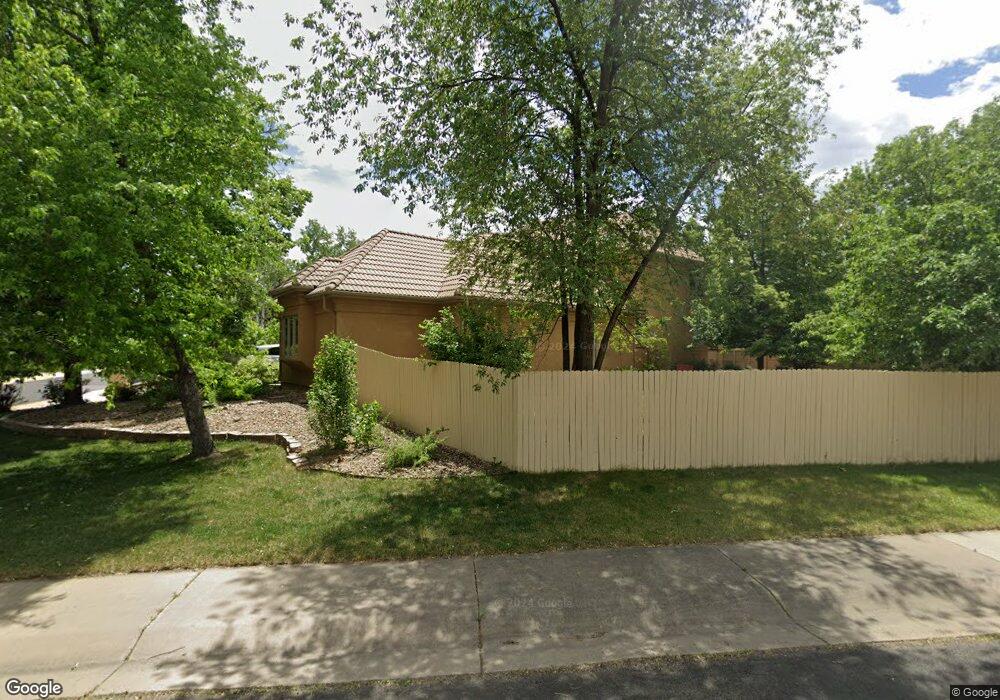
5235 Quail Hollow Ct Boulder, CO 80301
Gunbarrel NeighborhoodEstimated Value: $1,380,000 - $1,637,000
5
Beds
4
Baths
4,671
Sq Ft
$324/Sq Ft
Est. Value
About This Home
This home is located at 5235 Quail Hollow Ct, Boulder, CO 80301 and is currently estimated at $1,513,228, approximately $323 per square foot. 5235 Quail Hollow Ct is a home located in Boulder County with nearby schools including Heatherwood Elementary School, Nevin Platt Middle School, and Boulder High School.
Ownership History
Date
Name
Owned For
Owner Type
Purchase Details
Closed on
Jun 16, 2003
Sold by
Caird Martha Groves and Singh Martha
Bought by
Lee Shirley and Lee Denny
Current Estimated Value
Purchase Details
Closed on
Dec 11, 2002
Sold by
Singh Ram K and Singh Martha C
Bought by
Caird Martha Groves and Singh Martha
Purchase Details
Closed on
Apr 14, 1995
Sold by
Szarzec Bozena
Bought by
Singh Ram K
Home Financials for this Owner
Home Financials are based on the most recent Mortgage that was taken out on this home.
Original Mortgage
$270,000
Interest Rate
6.37%
Purchase Details
Closed on
May 3, 1991
Bought by
Lee Lee Shirley Shirley and Lee Denny
Purchase Details
Closed on
Mar 18, 1991
Bought by
Lee Lee Shirley Shirley and Lee Denny
Purchase Details
Closed on
Dec 19, 1988
Bought by
Lee Lee Shirley Shirley and Lee Denny
Create a Home Valuation Report for This Property
The Home Valuation Report is an in-depth analysis detailing your home's value as well as a comparison with similar homes in the area
Home Values in the Area
Average Home Value in this Area
Purchase History
| Date | Buyer | Sale Price | Title Company |
|---|---|---|---|
| Lee Shirley | $575,000 | Guardian Title | |
| Caird Martha Groves | -- | -- | |
| Singh Ram K | $360,000 | -- | |
| Lee Lee Shirley Shirley | $53,200 | -- | |
| Lee Lee Shirley Shirley | $751,000 | -- | |
| Lee Lee Shirley Shirley | $325,000 | -- |
Source: Public Records
Mortgage History
| Date | Status | Borrower | Loan Amount |
|---|---|---|---|
| Previous Owner | Singh Ram K | $270,000 |
Source: Public Records
Tax History Compared to Growth
Tax History
| Year | Tax Paid | Tax Assessment Tax Assessment Total Assessment is a certain percentage of the fair market value that is determined by local assessors to be the total taxable value of land and additions on the property. | Land | Improvement |
|---|---|---|---|---|
| 2025 | $7,639 | $93,438 | $37,813 | $55,625 |
| 2024 | $7,639 | $93,438 | $37,813 | $55,625 |
| 2023 | $7,506 | $93,619 | $40,971 | $56,334 |
| 2022 | $6,046 | $72,051 | $30,504 | $41,547 |
| 2021 | $6,380 | $74,124 | $31,381 | $42,743 |
| 2020 | $5,684 | $65,294 | $27,456 | $37,838 |
| 2019 | $5,597 | $65,294 | $27,456 | $37,838 |
| 2018 | $5,539 | $63,886 | $22,896 | $40,990 |
| 2017 | $5,366 | $70,629 | $25,313 | $45,316 |
| 2016 | $4,843 | $55,951 | $21,094 | $34,857 |
| 2015 | $4,586 | $51,358 | $26,746 | $24,612 |
| 2014 | $4,318 | $51,358 | $26,746 | $24,612 |
Source: Public Records
Map
Nearby Homes
- 5302 Pinehurst Dr
- 5291 Sun Dial Place
- 6972 Roaring Fork Trail
- 7329 Windsor Dr
- 7134 Cedarwood Cir
- 7126 Cedarwood Cir
- 6966 Harvest Rd
- 7238 Mount Sherman Rd
- 7264 Siena Way Unit C
- 5220 Desert Pine Ct
- 7400 Singing Hills Dr Unit K7400
- 4993 Clubhouse Ct
- 7434 Singing Hills Ct Unit J7434
- 7443 Singing Hills Ct
- 4953 Clubhouse Ct
- 5128 Buckingham Rd
- 7481 Singing Hills Dr
- 5174 Buckingham Rd Unit L1
- 4862 Silver Sage Ct
- 4936 Clubhouse Cir
- 5233 Pinehurst Dr
- 5239 Quail Hollow Ct
- 5255 Quail Hollow Ct
- 5236 Pinehurst Dr
- 5231 Pinehurst Dr
- 5248 Pinehurst Dr
- 5224 Pinehurst Dr
- 5243 Quail Hollow Ct
- 5249 Quail Hollow Ct
- 5247 Quail Hollow Ct
- 7127 Four Rivers Rd
- 5225 Pinehurst Dr
- 5257 Pinehurst Dr
- 5256 Pinehurst Dr
- 7125 Four Rivers Rd
- 5226 Deer Creek Ct
- 5222 Pinehurst Dr
- 5237 Deer Creek Ct
- 7175 Four Rivers Rd
- 7129 Four Rivers Rd