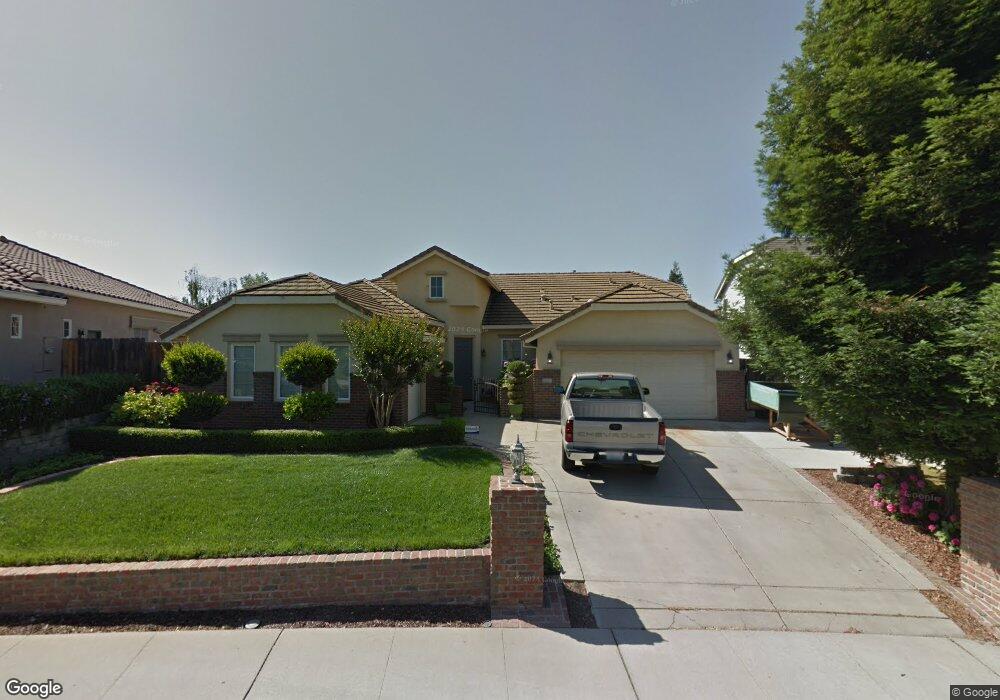
5237 New Britton Cir Antelope, CA 95843
Estimated Value: $585,000 - $614,848
3
Beds
2
Baths
2,090
Sq Ft
$287/Sq Ft
Est. Value
About This Home
This home is located at 5237 New Britton Cir, Antelope, CA 95843 and is currently estimated at $598,962, approximately $286 per square foot. 5237 New Britton Cir is a home located in Sacramento County with nearby schools including Olive Grove Elementary School, Antelope Crossing Middle School, and Antelope High School.
Ownership History
Date
Name
Owned For
Owner Type
Purchase Details
Closed on
Apr 15, 2015
Sold by
Golik Michelle
Bought by
Golik Michele A and Golik Stanley J
Current Estimated Value
Home Financials for this Owner
Home Financials are based on the most recent Mortgage that was taken out on this home.
Original Mortgage
$238,000
Outstanding Balance
$182,950
Interest Rate
3.7%
Mortgage Type
New Conventional
Estimated Equity
$416,012
Purchase Details
Closed on
Sep 27, 2005
Sold by
Golik Stanley
Bought by
Golik Michelle
Home Financials for this Owner
Home Financials are based on the most recent Mortgage that was taken out on this home.
Original Mortgage
$274,500
Interest Rate
5.7%
Mortgage Type
New Conventional
Purchase Details
Closed on
Oct 21, 2002
Sold by
Antelope Northwest Llc
Bought by
Golik Stanley and Golik Michelle
Home Financials for this Owner
Home Financials are based on the most recent Mortgage that was taken out on this home.
Original Mortgage
$212,000
Interest Rate
6.09%
Create a Home Valuation Report for This Property
The Home Valuation Report is an in-depth analysis detailing your home's value as well as a comparison with similar homes in the area
Home Values in the Area
Average Home Value in this Area
Purchase History
| Date | Buyer | Sale Price | Title Company |
|---|---|---|---|
| Golik Michele A | -- | Fidelity National Title Co | |
| Golik Michelle | -- | Alliance Title Company | |
| Golik Stanley | $273,000 | Old Republic Title Company |
Source: Public Records
Mortgage History
| Date | Status | Borrower | Loan Amount |
|---|---|---|---|
| Open | Golik Michele A | $238,000 | |
| Closed | Golik Michelle | $274,500 | |
| Closed | Golik Stanley | $212,000 |
Source: Public Records
Tax History
| Year | Tax Paid | Tax Assessment Tax Assessment Total Assessment is a certain percentage of the fair market value that is determined by local assessors to be the total taxable value of land and additions on the property. | Land | Improvement |
|---|---|---|---|---|
| 2025 | $4,457 | $425,934 | $86,889 | $339,045 |
| 2024 | $4,457 | $417,584 | $85,186 | $332,398 |
| 2023 | $5,218 | $409,397 | $83,516 | $325,881 |
| 2022 | $5,201 | $401,371 | $81,879 | $319,492 |
| 2021 | $5,202 | $393,502 | $80,274 | $313,228 |
| 2020 | $5,145 | $389,468 | $79,451 | $310,017 |
| 2019 | $5,062 | $381,833 | $77,894 | $303,939 |
| 2018 | $4,884 | $374,347 | $76,367 | $297,980 |
| 2017 | $4,803 | $367,008 | $74,870 | $292,138 |
| 2016 | $4,676 | $359,812 | $73,402 | $286,410 |
| 2015 | $4,585 | $354,408 | $72,300 | $282,108 |
| 2014 | $4,501 | $347,466 | $70,884 | $276,582 |
Source: Public Records
Map
Nearby Homes
- 8215 Gold Sierra Ct
- 8001 Ivory Peak Way
- 8009 Ivory Peak Way
- 8013 Ivory Peak Way
- 5807 Cerulean Hill Way
- 5751 Cerulean Hill Way
- 8012 Ivory Peak Way
- 8020 Ivory Peak Way
- 8226 Windmill Oaks Place
- 5763 Cerulean Hill Way
- 8279 Ghislaine Way
- 5775 Cerulean Hill Way
- 5136 Rosbury Dell Place
- 5826 Cerulean Hill Way
- 7929 Titan Dr
- 5822 Cerulean Hill Way
- 5818 Cerulean Hill Way
- 5814 Cerulean Hill Way
- 5806 Cerulean Hill Way
- 5827 Cerulean Hill Way
- 5241 New Britton Cir
- 5231 New Britton Cir
- 5331 New Britton Cir
- 5325 New Britton Cir
- 5335 New Britton Cir
- 5245 New Britton Cir
- 5236 New Britton Cir
- 5343 New Britton Cir
- 5244 New Britton Cir
- 5321 New Britton Cir
- 9401 Palmerson Dr
- 5248 New Britton Cir
- 9405 Palmerson Dr
- 5332 New Britton Cir
- 5336 New Britton Cir
- 5324 New Britton Cir
- 5401 Old England Ct
- 9364 Palmerson Dr
- 9411 Palmerson Dr
- 5340 New Britton Cir
Your Personal Tour Guide
Ask me questions while you tour the home.