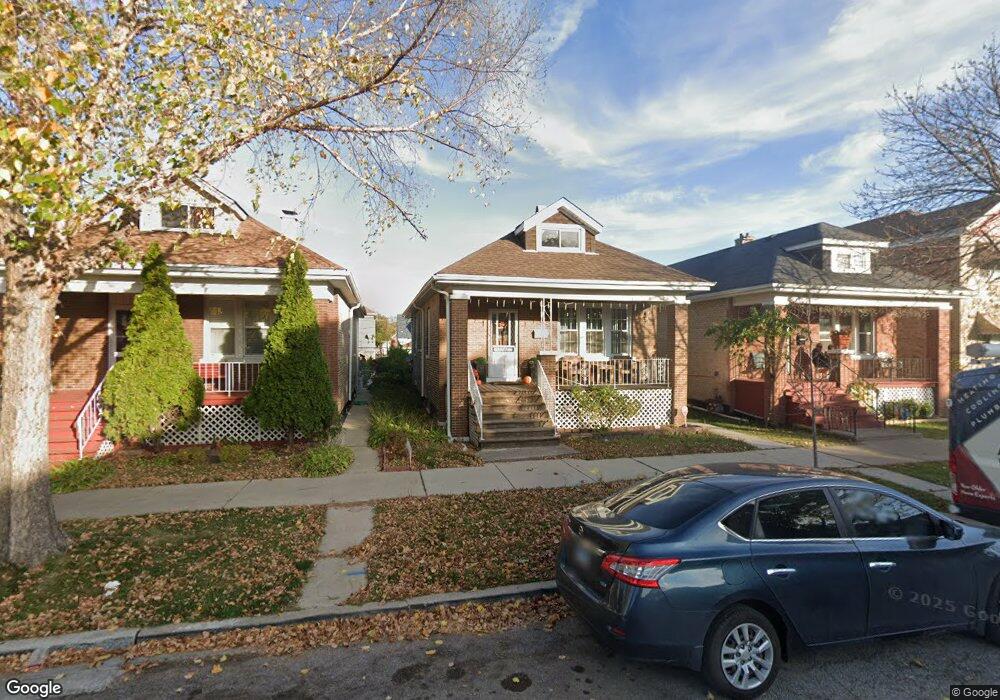
5237 S Mozart St Chicago, IL 60632
Gage Park NeighborhoodEstimated Value: $194,000 - $300,000
2
Beds
1
Bath
874
Sq Ft
$275/Sq Ft
Est. Value
About This Home
This home is located at 5237 S Mozart St, Chicago, IL 60632 and is currently estimated at $240,281, approximately $274 per square foot. 5237 S Mozart St is a home located in Cook County with nearby schools including Nightingale Elementary School, Kelly High School, and Acero - Rufino Tamayo Elementary School.
Ownership History
Date
Name
Owned For
Owner Type
Purchase Details
Closed on
Mar 18, 2022
Sold by
Villagrana Daniel
Bought by
Villagrana Fabiola and Chavez Luis A
Current Estimated Value
Purchase Details
Closed on
Apr 21, 2001
Sold by
Villagrana Daniel and Zavala Martin
Bought by
Villagrana Daniel and Duarte Pedro
Home Financials for this Owner
Home Financials are based on the most recent Mortgage that was taken out on this home.
Original Mortgage
$90,450
Interest Rate
6.95%
Purchase Details
Closed on
Nov 5, 1999
Sold by
Pehlke Nancy A
Bought by
Villagrana Daniel and Zavala Martin
Home Financials for this Owner
Home Financials are based on the most recent Mortgage that was taken out on this home.
Original Mortgage
$88,800
Interest Rate
7.72%
Purchase Details
Closed on
Apr 6, 1995
Sold by
Cullen Evelyn
Bought by
Cullen Evelyn and Cullen Trust
Create a Home Valuation Report for This Property
The Home Valuation Report is an in-depth analysis detailing your home's value as well as a comparison with similar homes in the area
Home Values in the Area
Average Home Value in this Area
Purchase History
| Date | Buyer | Sale Price | Title Company |
|---|---|---|---|
| Villagrana Fabiola | -- | None Listed On Document | |
| Villagrana Daniel | -- | Chicago Title Insurance Co | |
| Villagrana Daniel | $93,500 | -- | |
| Cullen Evelyn | -- | -- |
Source: Public Records
Mortgage History
| Date | Status | Borrower | Loan Amount |
|---|---|---|---|
| Previous Owner | Villagrana Daniel | $90,450 | |
| Previous Owner | Villagrana Daniel | $88,800 | |
| Closed | Villagrana Daniel | $2,500 |
Source: Public Records
Tax History Compared to Growth
Tax History
| Year | Tax Paid | Tax Assessment Tax Assessment Total Assessment is a certain percentage of the fair market value that is determined by local assessors to be the total taxable value of land and additions on the property. | Land | Improvement |
|---|---|---|---|---|
| 2024 | $2,266 | $16,000 | $1,995 | $14,005 |
| 2023 | $2,188 | $14,001 | $3,392 | $10,609 |
| 2022 | $2,188 | $14,001 | $3,392 | $10,609 |
| 2021 | $2,145 | $13,999 | $3,391 | $10,608 |
| 2020 | $1,709 | $10,726 | $3,391 | $7,335 |
| 2019 | $1,743 | $12,052 | $3,391 | $8,661 |
| 2018 | $1,713 | $12,052 | $3,391 | $8,661 |
| 2017 | $1,860 | $11,961 | $2,992 | $8,969 |
| 2016 | $1,908 | $11,961 | $2,992 | $8,969 |
| 2015 | $1,724 | $11,961 | $2,992 | $8,969 |
| 2014 | $1,615 | $11,206 | $2,793 | $8,413 |
| 2013 | $1,572 | $11,206 | $2,793 | $8,413 |
Source: Public Records
Map
Nearby Homes
- 5238 S Francisco Ave
- 5330 S California Ave
- 5254 S Sacramento Ave
- 5235 S Washtenaw Ave
- 5409 S Richmond St
- 5119 S Washtenaw Ave
- 5130 S Whipple St
- 5015 S Fairfield Ave
- 5151 S Troy St
- 5247 S Rockwell St
- 5145 S Troy St
- 5243 S Maplewood Ave
- 5544 S California Ave
- 5142 S Campbell Ave
- 5217 S Campbell Ave
- 5229 S Campbell Ave
- 5619 S California Ave
- 5359 S Sawyer Ave
- 5635 S California Ave
- 5207 S Artesian Ave
- 5233 S Mozart St
- 5233 S Mozart St
- 5229 S Mozart St
- 5243 S Mozart St Unit 1
- 5227 S Mozart St
- 5247 S Mozart St
- 5225 S Mozart St
- 5223 S Mozart St
- 5249 S Mozart St
- 5236 S California Ave
- 5232 S California Ave
- 5232 S California Ave
- 5240 S California Ave
- 5221 S Mozart St
- 5244 S California Ave
- 5253 S Mozart St
- 5232 S Mozart St
- 5232 S Mozart St
- 5230 S California Ave
- 5230 S California Ave