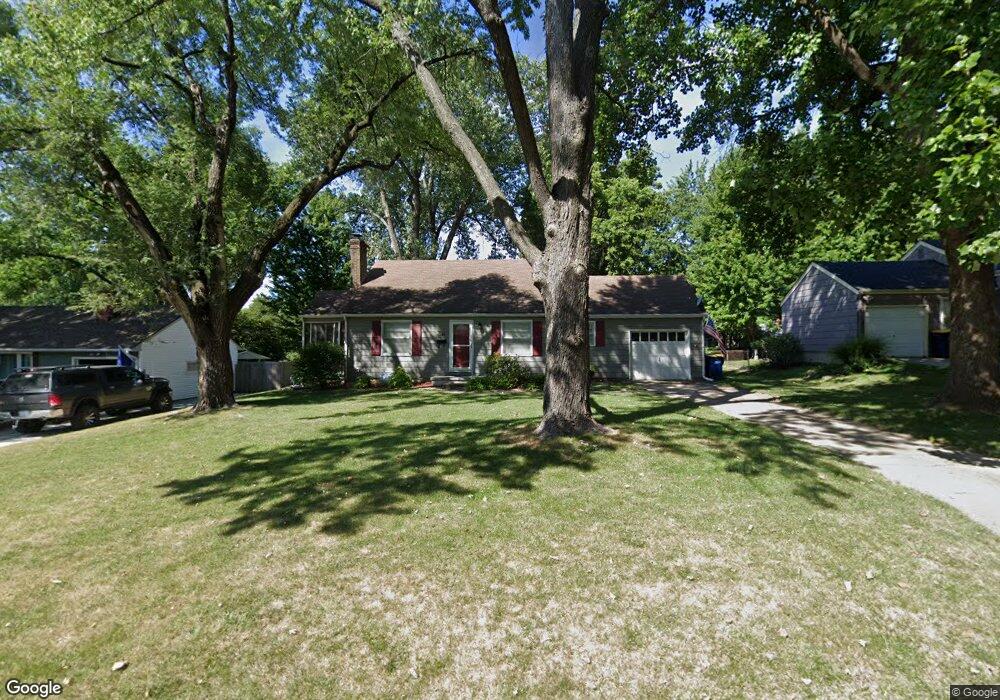
5238 Reeds Rd Mission, KS 66202
Estimated Value: $302,000 - $325,000
3
Beds
1
Bath
1,262
Sq Ft
$251/Sq Ft
Est. Value
About This Home
This home is located at 5238 Reeds Rd, Mission, KS 66202 and is currently estimated at $316,462, approximately $250 per square foot. 5238 Reeds Rd is a home located in Johnson County with nearby schools including Rushton Elementary School, Hocker Grove Middle School, and Shawnee Mission North High School.
Ownership History
Date
Name
Owned For
Owner Type
Purchase Details
Closed on
Aug 25, 2011
Sold by
Darby Joshua M and Darby Megan E
Bought by
Darby Joshua M and Darby Megan E
Current Estimated Value
Home Financials for this Owner
Home Financials are based on the most recent Mortgage that was taken out on this home.
Original Mortgage
$110,300
Outstanding Balance
$44,034
Interest Rate
4.53%
Mortgage Type
New Conventional
Estimated Equity
$272,428
Purchase Details
Closed on
Jul 9, 2007
Sold by
Hubert Luke A and Hubert Michelle L
Bought by
Darby Joshua M and Leimer Megan E
Home Financials for this Owner
Home Financials are based on the most recent Mortgage that was taken out on this home.
Original Mortgage
$21,742
Interest Rate
6.54%
Mortgage Type
Stand Alone Second
Purchase Details
Closed on
Oct 18, 2001
Sold by
Carr Kathleen A
Bought by
Hubert Luke A and Hubert Michelle L
Home Financials for this Owner
Home Financials are based on the most recent Mortgage that was taken out on this home.
Original Mortgage
$120,280
Interest Rate
6.85%
Create a Home Valuation Report for This Property
The Home Valuation Report is an in-depth analysis detailing your home's value as well as a comparison with similar homes in the area
Home Values in the Area
Average Home Value in this Area
Purchase History
| Date | Buyer | Sale Price | Title Company |
|---|---|---|---|
| Darby Joshua M | -- | Kansas City Title | |
| Darby Joshua M | -- | First American Title Ins | |
| Hubert Luke A | -- | Columbian National Title Ins |
Source: Public Records
Mortgage History
| Date | Status | Borrower | Loan Amount |
|---|---|---|---|
| Open | Darby Joshua M | $110,300 | |
| Closed | Darby Joshua M | $21,742 | |
| Closed | Darby Joshua M | $115,960 | |
| Previous Owner | Hubert Luke A | $120,280 |
Source: Public Records
Tax History Compared to Growth
Tax History
| Year | Tax Paid | Tax Assessment Tax Assessment Total Assessment is a certain percentage of the fair market value that is determined by local assessors to be the total taxable value of land and additions on the property. | Land | Improvement |
|---|---|---|---|---|
| 2024 | $3,929 | $31,452 | $8,748 | $22,704 |
| 2023 | $3,848 | $30,142 | $7,949 | $22,193 |
| 2022 | $3,683 | $29,256 | $7,223 | $22,033 |
| 2021 | $3,294 | $24,449 | $6,024 | $18,425 |
| 2020 | $3,263 | $23,817 | $5,236 | $18,581 |
| 2019 | $2,921 | $20,873 | $3,487 | $17,386 |
| 2018 | $2,862 | $20,171 | $3,487 | $16,684 |
| 2017 | $2,443 | $16,434 | $3,487 | $12,947 |
| 2016 | $2,334 | $15,376 | $3,487 | $11,889 |
| 2015 | $2,260 | $14,858 | $3,487 | $11,371 |
| 2013 | -- | $14,312 | $3,487 | $10,825 |
Source: Public Records
Map
Nearby Homes
- 5335 Maple St
- 5107 Reeds Rd
- 5226 Alder Dr
- 5509 W 50th Terrace
- 5429 Maple St
- 5434 Maple St
- 5431 Woodson Rd
- 5311 W 50th Terrace
- 5400 W 50th Terrace
- 5307 W 50th Terrace
- 5320 W 50th Terrace
- 5657 W 50th St
- 5407 W 50th St
- 5211 W 50th Terrace
- 5205 W 50th Terrace
- 5221 Juniper Dr
- 5516 Outlook St
- 5215 W 49th Terrace
- 5004 Juniper Dr
- 5543 Maple St