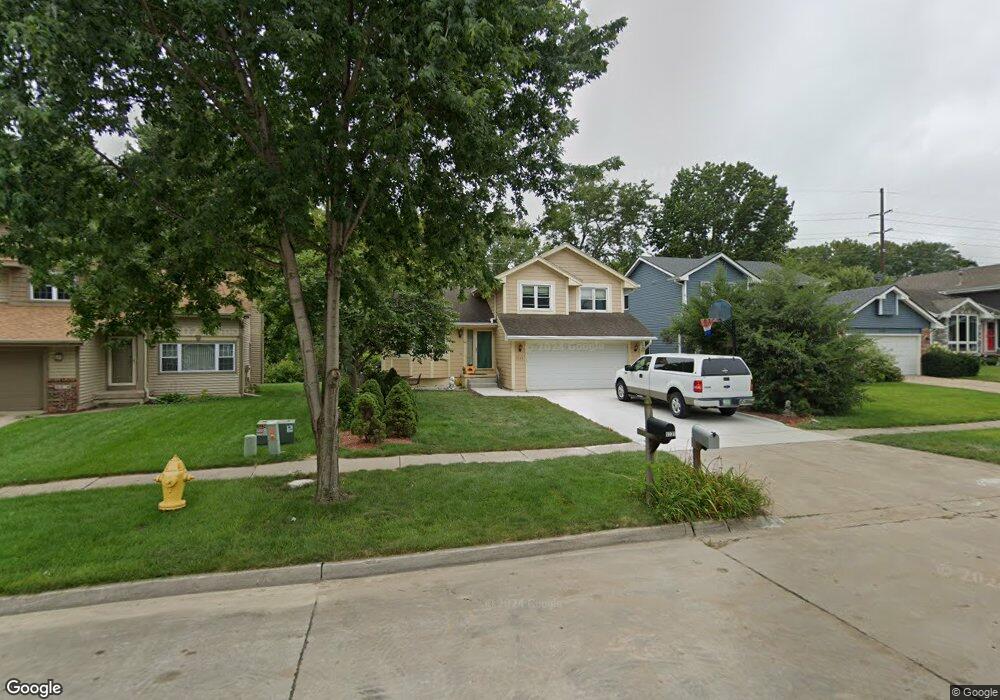
5238 Walnut St West Des Moines, IA 50265
Estimated Value: $292,000 - $337,000
3
Beds
3
Baths
1,488
Sq Ft
$211/Sq Ft
Est. Value
About This Home
This home is located at 5238 Walnut St, West Des Moines, IA 50265 and is currently estimated at $314,163, approximately $211 per square foot. 5238 Walnut St is a home located in Polk County with nearby schools including Crossroads Park Elementary School, Valley Southwoods Freshman High School, and Indian Hills Junior High School.
Ownership History
Date
Name
Owned For
Owner Type
Purchase Details
Closed on
Jun 15, 2021
Sold by
Edwards Kevin P and Carol S Edwards Revocable Trus
Bought by
Edwards Jeffrey L
Current Estimated Value
Purchase Details
Closed on
Sep 19, 2019
Sold by
H L Edwards Revocable Trust
Bought by
Edwards Kevin and Carol S Edwards Revocable Trus
Purchase Details
Closed on
Nov 22, 2011
Sold by
Edwards Harold L and Edwards Carol S
Bought by
Edwards Harold L
Purchase Details
Closed on
May 15, 1998
Sold by
Pierce Douglas W and Pierce Kimberly L
Bought by
Edwards Harold L
Create a Home Valuation Report for This Property
The Home Valuation Report is an in-depth analysis detailing your home's value as well as a comparison with similar homes in the area
Home Values in the Area
Average Home Value in this Area
Purchase History
| Date | Buyer | Sale Price | Title Company |
|---|---|---|---|
| Edwards Jeffrey L | -- | None Available | |
| Edwards Kevin | -- | None Available | |
| Edwards Harold L | -- | None Available | |
| Edwards Harold L | $125,500 | -- |
Source: Public Records
Tax History Compared to Growth
Tax History
| Year | Tax Paid | Tax Assessment Tax Assessment Total Assessment is a certain percentage of the fair market value that is determined by local assessors to be the total taxable value of land and additions on the property. | Land | Improvement |
|---|---|---|---|---|
| 2025 | $3,994 | $294,700 | $57,000 | $237,700 |
| 2024 | $3,994 | $269,500 | $52,800 | $216,700 |
| 2023 | $4,176 | $269,500 | $52,800 | $216,700 |
| 2022 | $4,124 | $225,100 | $44,800 | $180,300 |
| 2021 | $3,930 | $225,100 | $44,800 | $180,300 |
| 2020 | $4,042 | $204,600 | $40,700 | $163,900 |
| 2019 | $3,804 | $204,600 | $40,700 | $163,900 |
| 2018 | $3,814 | $185,700 | $36,300 | $149,400 |
| 2017 | $3,600 | $185,700 | $36,300 | $149,400 |
| 2016 | $3,522 | $170,300 | $32,600 | $137,700 |
| 2015 | $3,522 | $170,300 | $32,600 | $137,700 |
| 2014 | $3,276 | $156,600 | $29,500 | $127,100 |
Source: Public Records
Map
Nearby Homes