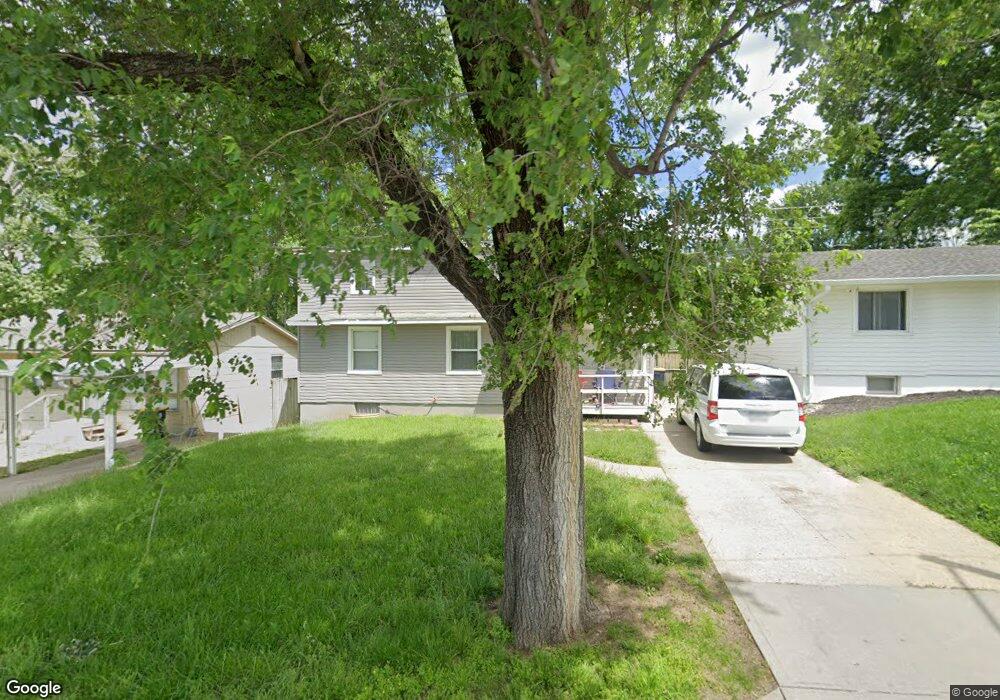
5239 Sycamore Ave Kansas City, MO 64129
Eastwood Hills East NeighborhoodEstimated Value: $118,000 - $169,000
4
Beds
2
Baths
1,164
Sq Ft
$129/Sq Ft
Est. Value
About This Home
This home is located at 5239 Sycamore Ave, Kansas City, MO 64129 and is currently estimated at $150,050, approximately $128 per square foot. 5239 Sycamore Ave is a home located in Jackson County with nearby schools including Eastwood Hills Elementary, Raytown Middle School, and Raytown South High School.
Ownership History
Date
Name
Owned For
Owner Type
Purchase Details
Closed on
Jul 23, 2013
Sold by
Stewart Nicholas
Bought by
Stewart Emmad
Current Estimated Value
Purchase Details
Closed on
Apr 10, 2013
Sold by
Stewart Derrick
Bought by
Stewart Nicholas
Purchase Details
Closed on
Aug 20, 2012
Sold by
Stewart Nicholas
Bought by
Stewart Derrich
Purchase Details
Closed on
Feb 21, 2008
Sold by
U S Bank Na
Bought by
Stewart Nicholas
Purchase Details
Closed on
Jul 6, 2007
Sold by
Briscoe Dimitri D
Bought by
Us Bank Na and Credit Suisse Heat 2006-1
Purchase Details
Closed on
Apr 5, 2005
Sold by
Cooper Lalaunda and Cooper Lelaunda Letrice
Bought by
Briscoe Dimitri
Home Financials for this Owner
Home Financials are based on the most recent Mortgage that was taken out on this home.
Original Mortgage
$54,000
Interest Rate
6.75%
Mortgage Type
Purchase Money Mortgage
Purchase Details
Closed on
Nov 11, 1998
Sold by
Cartmill Barbara J and Cartmill Barbara J
Bought by
Cooper Michael and Cooper Lalaunda
Create a Home Valuation Report for This Property
The Home Valuation Report is an in-depth analysis detailing your home's value as well as a comparison with similar homes in the area
Home Values in the Area
Average Home Value in this Area
Purchase History
| Date | Buyer | Sale Price | Title Company |
|---|---|---|---|
| Stewart Emmad | -- | None Available | |
| Stewart Nicholas | -- | None Available | |
| Stewart Derrich | $500 | None Available | |
| Stewart Nicholas | $18,000 | First American Title Ins | |
| Us Bank Na | $48,000 | None Available | |
| Briscoe Dimitri | -- | Parkway Title Inc | |
| Cooper Michael | -- | Stewart Title |
Source: Public Records
Mortgage History
| Date | Status | Borrower | Loan Amount |
|---|---|---|---|
| Previous Owner | Briscoe Dimitri | $54,000 |
Source: Public Records
Tax History Compared to Growth
Tax History
| Year | Tax Paid | Tax Assessment Tax Assessment Total Assessment is a certain percentage of the fair market value that is determined by local assessors to be the total taxable value of land and additions on the property. | Land | Improvement |
|---|---|---|---|---|
| 2025 | $1,753 | $12,813 | $2,219 | $10,594 |
| 2024 | $1,741 | $19,365 | $1,433 | $17,932 |
| 2023 | $1,741 | $19,365 | $1,258 | $18,107 |
| 2022 | $907 | $9,690 | $1,530 | $8,160 |
| 2021 | $906 | $9,690 | $1,530 | $8,160 |
| 2020 | $913 | $9,641 | $1,530 | $8,111 |
| 2019 | $895 | $9,641 | $1,530 | $8,111 |
| 2018 | $873 | $9,434 | $2,115 | $7,319 |
| 2017 | $873 | $9,434 | $2,115 | $7,319 |
| 2016 | $845 | $9,198 | $1,957 | $7,241 |
| 2014 | $823 | $8,930 | $1,900 | $7,030 |
Source: Public Records
Map
Nearby Homes
- 5132 Skiles Ave
- 4701 Skiles Ave
- 7525 E 52nd St
- 5140 Booth Ave
- 5002 Skiles Ave
- 7803 E 50th Terrace
- 4958 Marsh Ave
- 5117 Booth Ave
- 5119 Booth Ave
- 5500 Wallace Ave
- 4949 Laramie Ln
- 7509 E 50th St
- 8705 E 53rd Terrace
- 7605 Sni A Bar Terrace
- 5609 Oakland Ave
- 5611 Oakland Ave
- 7405 E 49th St
- 4881 Wallace Ave
- 7410 E 57th St
- 7700 E 48th Terrace
- 5243 Sycamore Ave
- 5233 Sycamore Ave
- 5229 Sycamore Ave
- 5247 Sycamore Ave
- 5225 Sycamore Ave
- 5251 Sycamore Ave
- 5255 Sycamore Ave
- 5221 Sycamore Ave
- 5232 Skiles Ave
- 5238 Skiles Ave
- 5259 Sycamore Ave
- 5228 Skiles Ave
- 5242 Skiles Ave
- 5224 Skiles Ave
- 5246 Skiles Ave
- 5263 Sycamore Ave
- 5250 Skiles Ave
- 5211 Sycamore Ave
- 5220 Skiles Ave
- 5208 Sycamore Ave