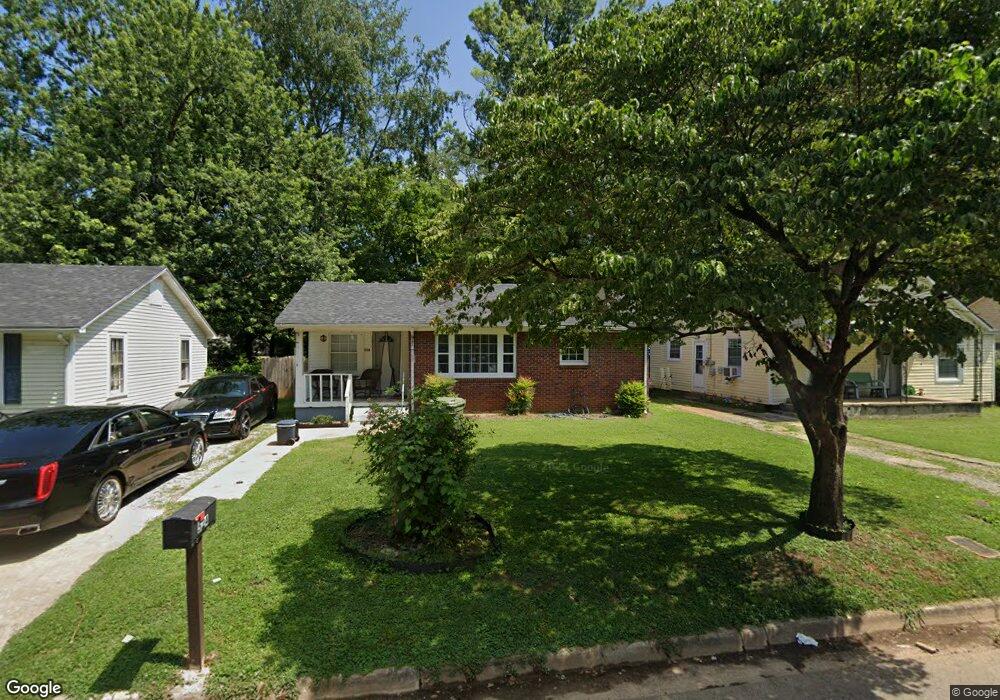
524 2nd St Lawrenceburg, TN 38464
Estimated Value: $94,000 - $187,000
Studio
1
Bath
1,424
Sq Ft
$89/Sq Ft
Est. Value
About This Home
This home is located at 524 2nd St, Lawrenceburg, TN 38464 and is currently estimated at $126,899, approximately $89 per square foot. 524 2nd St is a home located in Lawrence County with nearby schools including Ingram Sowell Elementary School, Lawrenceburg Public Elementary School, and David Crockett Elementary School.
Ownership History
Date
Name
Owned For
Owner Type
Purchase Details
Closed on
May 21, 2015
Sold by
Liebhart David Mack
Bought by
Porter Anita
Current Estimated Value
Purchase Details
Closed on
Jun 22, 2004
Bought by
Liebhart David Mack
Purchase Details
Closed on
Dec 18, 2001
Sold by
Braly Michael R
Bought by
Rudolph Linda S
Purchase Details
Closed on
Aug 27, 2001
Sold by
Beard Mary R
Bought by
Braly Michael R
Purchase Details
Closed on
Aug 24, 1953
Bought by
Beard George D and Beard Mary
Create a Home Valuation Report for This Property
The Home Valuation Report is an in-depth analysis detailing your home's value as well as a comparison with similar homes in the area
Home Values in the Area
Average Home Value in this Area
Purchase History
| Date | Buyer | Sale Price | Title Company |
|---|---|---|---|
| Porter Anita | $18,000 | -- | |
| Liebhart David Mack | -- | -- | |
| Rudolph Linda S | $42,000 | -- | |
| Braly Michael R | $29,000 | -- | |
| Beard George D | -- | -- |
Source: Public Records
Tax History
| Year | Tax Paid | Tax Assessment Tax Assessment Total Assessment is a certain percentage of the fair market value that is determined by local assessors to be the total taxable value of land and additions on the property. | Land | Improvement |
|---|---|---|---|---|
| 2025 | $445 | $14,325 | $1,500 | $12,825 |
| 2024 | $445 | $14,325 | $1,500 | $12,825 |
| 2023 | $445 | $14,325 | $1,500 | $12,825 |
| 2022 | $445 | $14,325 | $1,500 | $12,825 |
| 2021 | $297 | $6,775 | $1,500 | $5,275 |
| 2020 | $297 | $6,775 | $1,500 | $5,275 |
| 2019 | $297 | $6,775 | $1,500 | $5,275 |
| 2018 | $297 | $6,775 | $1,500 | $5,275 |
| 2017 | $297 | $6,775 | $1,500 | $5,275 |
| 2016 | $297 | $6,775 | $1,500 | $5,275 |
| 2015 | $282 | $6,775 | $1,500 | $5,275 |
| 2014 | $500 | $12,025 | $1,500 | $10,525 |
Source: Public Records
Map
Nearby Homes
Your Personal Tour Guide
Ask me questions while you tour the home.