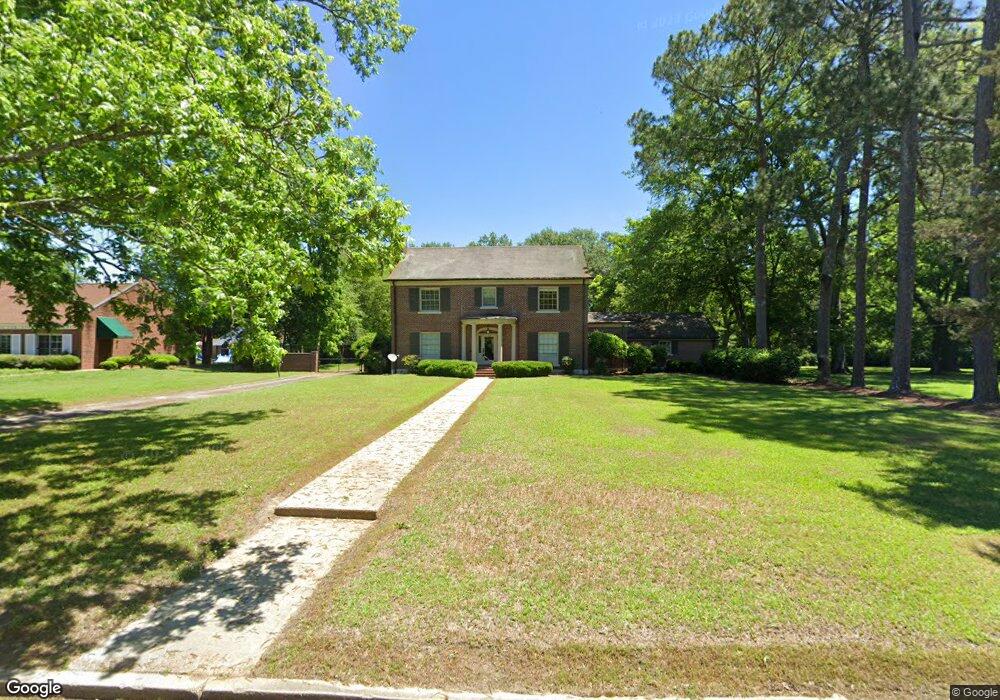
524 Calhoun St West Point, MS 39773
Estimated Value: $351,000 - $371,000
4
Beds
--
Bath
4,395
Sq Ft
$83/Sq Ft
Est. Value
About This Home
This home is located at 524 Calhoun St, West Point, MS 39773 and is currently estimated at $364,447, approximately $82 per square foot. 524 Calhoun St is a home located in Clay County with nearby schools including East Side Elementary School, West Clay Elementary School, and Church Hill Elementary School.
Ownership History
Date
Name
Owned For
Owner Type
Purchase Details
Closed on
Mar 14, 2024
Sold by
Regional Foundation For Mental Health An and Regional Foundation For Mental Health An
Bought by
Nance Eric Kendall and Nance Hurshell
Current Estimated Value
Purchase Details
Closed on
Aug 25, 2023
Sold by
Regional Foundation For Mental Health An
Bought by
Shrimp Pimp Llc
Purchase Details
Closed on
Feb 3, 2017
Sold by
Harrell James Bryan and Harrell Laurann Garley
Bought by
Regionall Foundation/Mental Health & Ret
Create a Home Valuation Report for This Property
The Home Valuation Report is an in-depth analysis detailing your home's value as well as a comparison with similar homes in the area
Purchase History
| Date | Buyer | Sale Price | Title Company |
|---|---|---|---|
| Nance Eric Kendall | -- | None Listed On Document | |
| Shrimp Pimp Llc | -- | None Listed On Document | |
| Regionall Foundation/Mental Health & Ret | -- | -- |
Source: Public Records
Tax History
| Year | Tax Paid | Tax Assessment Tax Assessment Total Assessment is a certain percentage of the fair market value that is determined by local assessors to be the total taxable value of land and additions on the property. | Land | Improvement |
|---|---|---|---|---|
| 2025 | -- | $51,500 | $2,848 | $48,652 |
| 2024 | -- | $51,500 | $2,848 | $48,652 |
| 2023 | $0 | $42,523 | $2,848 | $39,675 |
| 2022 | $0 | $42,523 | $2,848 | $39,675 |
| 2021 | $0 | $42,523 | $2,848 | $39,675 |
| 2020 | $0 | $42,523 | $2,848 | $39,675 |
| 2019 | $2,088 | $42,162 | $2,848 | $39,314 |
| 2018 | $0 | $42,162 | $2,848 | $39,314 |
| 2017 | $2,088 | $42,351 | $3,037 | $39,314 |
| 2016 | $2,046 | $42,351 | $3,037 | $39,314 |
| 2015 | $2,040 | $40,893 | $3,037 | $37,856 |
| 2014 | $1,022 | $27,262 | $2,025 | $25,237 |
| 2013 | $1,022 | $27,262 | $2,025 | $25,237 |
Source: Public Records
Map
Nearby Homes
- 238 Calhoun St
- 480 E Westbrook St
- 184 Tournament St
- 551 E Westbrook St
- 33 Court
- 26788 E Main St
- 26852 E Main St
- 228 S Division St
- 74 Tom Bayne St
- 341 Mccord St
- 229 S Division St
- 26596 E Main St
- 228 Mccord St
- 1046 E Brame Ave
- 27045 E Main St
- 507 S Eshman Ave
- 405 S Eshman Ave
- 913 E Westbrook St
- 123 Cottrell St
- 472 S Eshman Ave
Your Personal Tour Guide
Ask me questions while you tour the home.