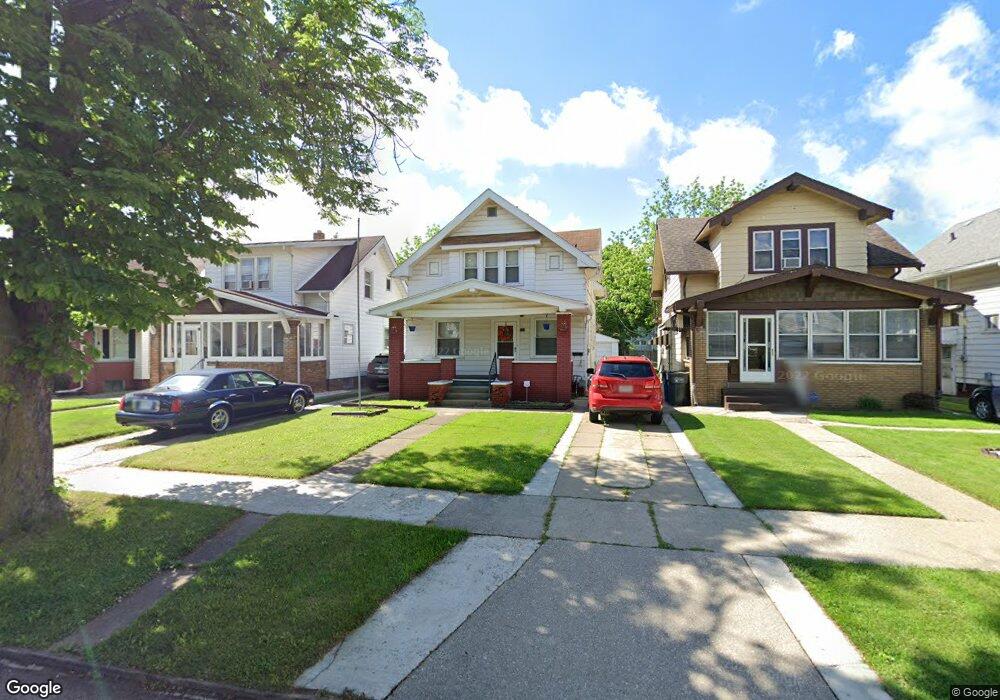
524 E Weber St Toledo, OH 43608
Lagrange NeighborhoodEstimated Value: $43,000 - $60,000
3
Beds
1
Bath
1,310
Sq Ft
$41/Sq Ft
Est. Value
About This Home
This home is located at 524 E Weber St, Toledo, OH 43608 and is currently estimated at $53,748, approximately $41 per square foot. 524 E Weber St is a home located in Lucas County with nearby schools including Leverette Elementary School, Woodward High School, and Imagine Environmental Science Academy.
Ownership History
Date
Name
Owned For
Owner Type
Purchase Details
Closed on
Jan 11, 2024
Sold by
Jlw Wolverines Llc
Bought by
Fanning Cynthia E
Current Estimated Value
Home Financials for this Owner
Home Financials are based on the most recent Mortgage that was taken out on this home.
Original Mortgage
$27,450
Outstanding Balance
$23,431
Interest Rate
6.29%
Mortgage Type
New Conventional
Estimated Equity
$30,317
Purchase Details
Closed on
Oct 27, 2021
Sold by
Walker George and Walker Thrana L
Bought by
Jlw Wolverines Llc
Purchase Details
Closed on
May 30, 2013
Sold by
Walker Thrana L
Bought by
Walker A George
Purchase Details
Closed on
Dec 30, 2008
Sold by
Fifth Third Bank
Bought by
Walker A George and Walker Thrana L
Purchase Details
Closed on
Jul 17, 2007
Sold by
Majewski Elaine F
Bought by
Fifth Third Bank
Create a Home Valuation Report for This Property
The Home Valuation Report is an in-depth analysis detailing your home's value as well as a comparison with similar homes in the area
Home Values in the Area
Average Home Value in this Area
Purchase History
| Date | Buyer | Sale Price | Title Company |
|---|---|---|---|
| Fanning Cynthia E | $32,500 | Area Title | |
| Jlw Wolverines Llc | $25,000 | None Listed On Document | |
| Walker A George | -- | None Available | |
| Walker A George | $15,000 | Prism Title & Closing Servic | |
| Fifth Third Bank | -- | Attorney |
Source: Public Records
Mortgage History
| Date | Status | Borrower | Loan Amount |
|---|---|---|---|
| Open | Fanning Cynthia E | $27,450 |
Source: Public Records
Tax History
| Year | Tax Paid | Tax Assessment Tax Assessment Total Assessment is a certain percentage of the fair market value that is determined by local assessors to be the total taxable value of land and additions on the property. | Land | Improvement |
|---|---|---|---|---|
| 2025 | -- | $11,900 | $1,750 | $10,150 |
| 2024 | $415 | $11,900 | $1,750 | $10,150 |
| 2023 | $566 | $7,525 | $1,750 | $5,775 |
| 2022 | $564 | $7,525 | $1,750 | $5,775 |
| 2021 | $573 | $7,525 | $1,750 | $5,775 |
| 2020 | $619 | $7,175 | $1,645 | $5,530 |
| 2019 | $603 | $7,175 | $1,645 | $5,530 |
| 2018 | $788 | $7,175 | $1,645 | $5,530 |
| 2017 | $976 | $12,005 | $1,610 | $10,395 |
| 2016 | $979 | $34,300 | $4,600 | $29,700 |
| 2015 | $971 | $34,300 | $4,600 | $29,700 |
| 2014 | $776 | $12,010 | $1,610 | $10,400 |
| 2013 | $776 | $12,010 | $1,610 | $10,400 |
Source: Public Records
Map
Nearby Homes
- 439 E Weber St
- 3119 Mulberry St
- 420 E Oakland St
- 3118 Elm St
- 3245 Elm St
- 451 E Pearl St
- 3342 Elm St
- 346 E Weber St
- 346 E Streicher St
- 2919 Chestnut St
- 537 Dexter St
- 319 E Streicher St
- 332 Kosciusko St
- 815 Woodward Ave
- 427 Everett St
- 3350 Maple St
- 330 E Lake St
- 2824 Chestnut St
- 231 E Central Ave
- 2927 Stickney Ave
- 522 E Weber St
- 526 E Weber St
- 520 E Weber St
- 530 E Weber St
- 514 E Weber St
- 534 E Weber St
- 523 E Streicher St
- 519 E Streicher St
- 527 E Streicher St
- 510 E Weber St
- 536 E Weber St
- 515 E Streicher St
- 529 E Streicher St
- 513 E Streicher St
- 533 E Streicher St
- 506 E Weber St
- 540 E Weber St
- 511 E Streicher St
- 535 E Streicher St
- 521 E Weber St
Your Personal Tour Guide
Ask me questions while you tour the home.