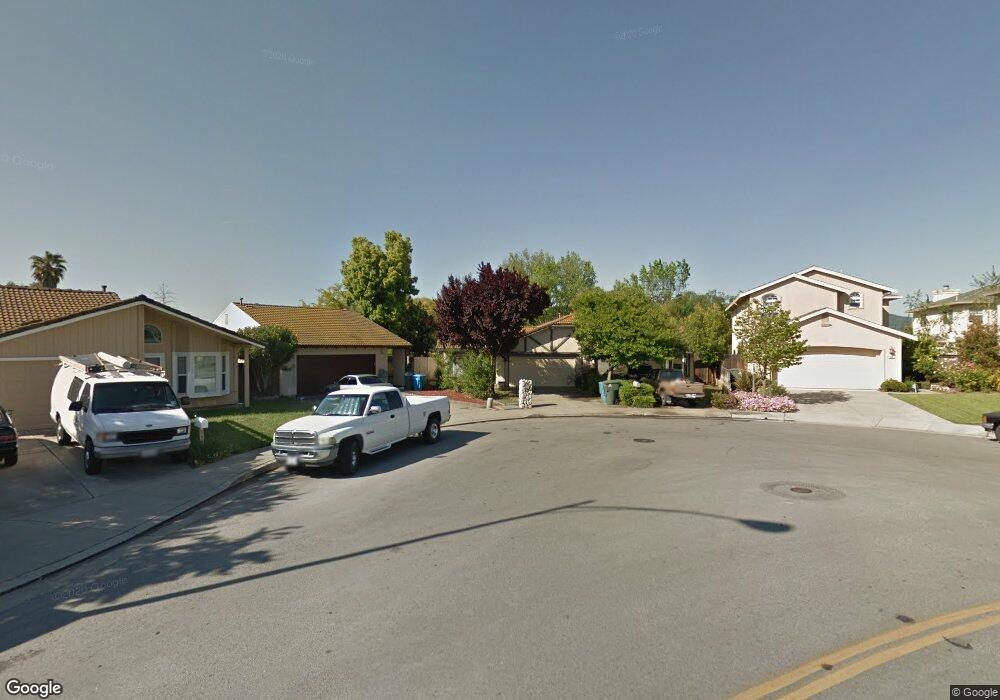
524 Hoover Ct Gilroy, CA 95020
Estimated Value: $670,000 - $919,000
3
Beds
2
Baths
1,204
Sq Ft
$664/Sq Ft
Est. Value
About This Home
This home is located at 524 Hoover Ct, Gilroy, CA 95020 and is currently estimated at $799,370, approximately $663 per square foot. 524 Hoover Ct is a home located in Santa Clara County with nearby schools including Eliot Elementary School, Brownell Middle School, and Solorsano Middle School.
Ownership History
Date
Name
Owned For
Owner Type
Purchase Details
Closed on
Dec 28, 2009
Sold by
Federal National Mortgage Association
Bought by
Tordesillas Juan Dennis C
Current Estimated Value
Home Financials for this Owner
Home Financials are based on the most recent Mortgage that was taken out on this home.
Original Mortgage
$266,000
Outstanding Balance
$173,132
Interest Rate
4.78%
Mortgage Type
New Conventional
Estimated Equity
$626,238
Purchase Details
Closed on
Sep 3, 2009
Sold by
Mandujano Maria S
Bought by
Federal National Mortgage Association
Purchase Details
Closed on
Aug 8, 1999
Sold by
Mandujano Cresencio B and Mandujano Maria S
Bought by
Mandujano Maria S
Home Financials for this Owner
Home Financials are based on the most recent Mortgage that was taken out on this home.
Original Mortgage
$168,750
Interest Rate
9.75%
Create a Home Valuation Report for This Property
The Home Valuation Report is an in-depth analysis detailing your home's value as well as a comparison with similar homes in the area
Home Values in the Area
Average Home Value in this Area
Purchase History
| Date | Buyer | Sale Price | Title Company |
|---|---|---|---|
| Tordesillas Juan Dennis C | $280,000 | Lawyers Title Company | |
| Federal National Mortgage Association | $444,306 | None Available | |
| Mandujano Maria S | -- | Financial Title Company |
Source: Public Records
Mortgage History
| Date | Status | Borrower | Loan Amount |
|---|---|---|---|
| Open | Tordesillas Juan Dennis C | $266,000 | |
| Previous Owner | Mandujano Maria S | $168,750 |
Source: Public Records
Tax History Compared to Growth
Tax History
| Year | Tax Paid | Tax Assessment Tax Assessment Total Assessment is a certain percentage of the fair market value that is determined by local assessors to be the total taxable value of land and additions on the property. | Land | Improvement |
|---|---|---|---|---|
| 2025 | $4,388 | $361,413 | $162,634 | $198,779 |
| 2024 | $4,388 | $354,328 | $159,446 | $194,882 |
| 2023 | $4,360 | $347,381 | $156,320 | $191,061 |
| 2022 | $4,287 | $340,570 | $153,255 | $187,315 |
| 2021 | $4,265 | $333,893 | $150,250 | $183,643 |
| 2020 | $4,217 | $330,470 | $148,710 | $181,760 |
| 2019 | $4,177 | $323,992 | $145,795 | $178,197 |
| 2018 | $3,901 | $317,640 | $142,937 | $174,703 |
| 2017 | $3,980 | $311,413 | $140,135 | $171,278 |
| 2016 | $3,893 | $305,308 | $137,388 | $167,920 |
| 2015 | $3,674 | $300,723 | $135,325 | $165,398 |
| 2014 | $3,649 | $294,834 | $132,675 | $162,159 |
Source: Public Records
Map
Nearby Homes
- 7521 Chestnut St
- 332 Lewis St Unit 1/2
- 332 Lewis St
- 7743 Chestnut St
- 7621 Forest St
- 7759 Murray Ave
- 188 Caroline Ln
- 160 Sarafina Way
- 0 Monterey Rd
- 7711 Monterey St
- 194 4th St
- 286 5th St
- 7691 Church St Unit B
- 7191 Eigleberry St
- 8282 Murray Ave Unit 99
- 8282 Murray Ave Unit 76
- 0 Pacheco Pass Hwy
- 7630 Hanna St
- 8180 Forest St
- 8282 Murray #90 Ave Unit 90
- 514 Hoover Ct
- 534 Hoover Ct
- 512 Hoover Ct
- 462 Hadley Ct
- 544 Hoover Ct
- 452 Hadley Ct
- 472 Hadley Ct
- 442 Hadley Ct
- 510 Hoover Ct
- 554 Hoover Ct
- 0 Hoover Ct Unit ML81218098
- 0000 Hoover Ct
- 0 Hoover Ct Unit ML81601410
- 506 Hoover Ct
- 432 Hadley Ct
- 508 Hoover Ct
- 564 Hoover Ct
- 422 Hadley Ct
- 571 Hoover Ct
- 7500 Chestnut St