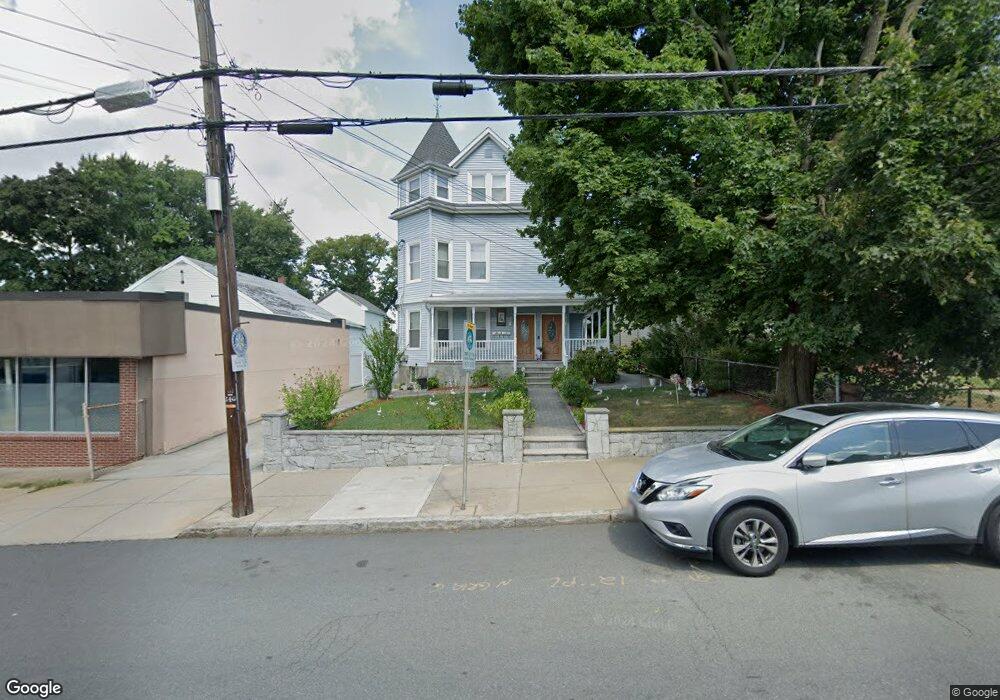
524 Main St Medford, MA 02155
South Medford NeighborhoodEstimated Value: $1,092,000 - $1,389,000
5
Beds
3
Baths
3,083
Sq Ft
$400/Sq Ft
Est. Value
About This Home
This home is located at 524 Main St, Medford, MA 02155 and is currently estimated at $1,232,467, approximately $399 per square foot. 524 Main St is a home located in Middlesex County with nearby schools including Medford High School, St. Clement Elementary School, and Bright Future Educare Center.
Ownership History
Date
Name
Owned For
Owner Type
Purchase Details
Closed on
Mar 21, 2003
Sold by
Mannan Manoj and Mannan Pawan
Bought by
Candeias Iva M and Candeias Manuel S
Current Estimated Value
Home Financials for this Owner
Home Financials are based on the most recent Mortgage that was taken out on this home.
Original Mortgage
$380,000
Outstanding Balance
$163,600
Interest Rate
5.9%
Mortgage Type
Purchase Money Mortgage
Estimated Equity
$1,068,867
Create a Home Valuation Report for This Property
The Home Valuation Report is an in-depth analysis detailing your home's value as well as a comparison with similar homes in the area
Home Values in the Area
Average Home Value in this Area
Purchase History
| Date | Buyer | Sale Price | Title Company |
|---|---|---|---|
| Candeias Iva M | $550,000 | -- |
Source: Public Records
Mortgage History
| Date | Status | Borrower | Loan Amount |
|---|---|---|---|
| Open | Candeias Iva M | $380,000 |
Source: Public Records
Tax History Compared to Growth
Tax History
| Year | Tax Paid | Tax Assessment Tax Assessment Total Assessment is a certain percentage of the fair market value that is determined by local assessors to be the total taxable value of land and additions on the property. | Land | Improvement |
|---|---|---|---|---|
| 2025 | $10,405 | $1,182,400 | $384,400 | $798,000 |
| 2024 | $9,209 | $1,080,900 | $366,100 | $714,800 |
| 2023 | $9,034 | $1,044,400 | $342,100 | $702,300 |
| 2022 | $9,131 | $1,013,400 | $311,100 | $702,300 |
| 2021 | $8,550 | $908,600 | $296,200 | $612,400 |
| 2020 | $8,433 | $918,600 | $296,200 | $622,400 |
| 2019 | $8,032 | $836,700 | $269,300 | $567,400 |
| 2018 | $7,626 | $744,700 | $244,800 | $499,900 |
| 2017 | $7,142 | $676,300 | $228,800 | $447,500 |
| 2016 | $6,971 | $623,000 | $208,000 | $415,000 |
| 2015 | $6,559 | $560,600 | $198,100 | $362,500 |
Source: Public Records
Map
Nearby Homes
- 552 Main St
- 57 Edward St
- 501 Main St
- 474 Broadway Unit 26
- 561 Broadway Unit C1
- 34 Fiske Ave Unit C
- 34 Fiske Ave Unit B
- 34 Fiske Ave Unit A
- 441 Broadway
- 9 Norwood Ave
- 3 Vinal St
- 496 Medford St
- 595 Broadway Unit 302
- 595 Broadway Unit 101
- 595 Broadway Unit 202
- 35 Richardson St Unit 2
- 35 Richardson St Unit 4
- 35 Richardson St Unit Cottage
- 32 Richardson St
- 100 Fremont St
- 524 Main St Unit 1
- 528 Main St
- 528 Main St Unit 2
- 522 Main St
- 532 Main St
- 532 Main St Unit 1
- 518 Main St Unit 2
- 518 Main St Unit 1
- 518 Main St Unit B
- 518 Main St Unit A
- 518 Main St
- 536 Main St
- 516 Main St
- 10 Whittemore St
- 14 Whittemore St
- 523 Main St
- 525 Main St
- 525 Main St Unit 1
- 525 Main St Unit 2
- 18 Whittemore St