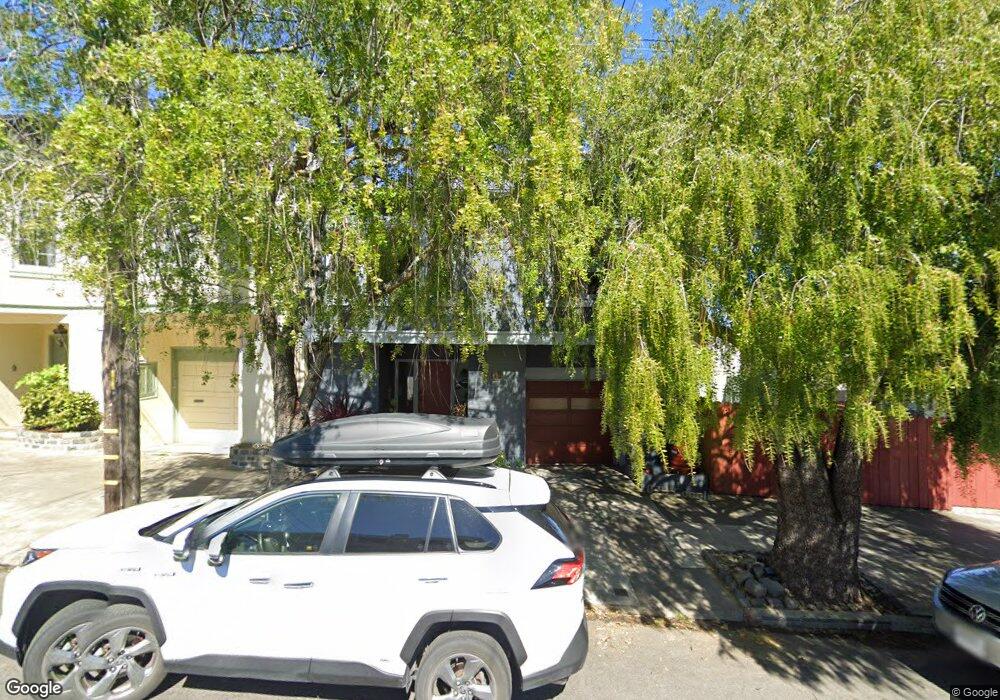
524 Moraga St San Francisco, CA 94122
Inner Sunset NeighborhoodEstimated Value: $1,712,000 - $2,122,709
3
Beds
1
Bath
1,496
Sq Ft
$1,283/Sq Ft
Est. Value
About This Home
This home is located at 524 Moraga St, San Francisco, CA 94122 and is currently estimated at $1,919,677, approximately $1,283 per square foot. 524 Moraga St is a home located in San Francisco County with nearby schools including Clarendon Alternative Elementary School, Presidio Middle School, and Cornerstone Academy-Lawton Campus.
Ownership History
Date
Name
Owned For
Owner Type
Purchase Details
Closed on
Aug 1, 2011
Sold by
Thompson Ana
Bought by
Cosentino Christopher and Graf Tatiana
Current Estimated Value
Home Financials for this Owner
Home Financials are based on the most recent Mortgage that was taken out on this home.
Original Mortgage
$558,000
Outstanding Balance
$384,366
Interest Rate
4.46%
Mortgage Type
New Conventional
Estimated Equity
$1,535,311
Purchase Details
Closed on
Jul 7, 2004
Sold by
Evans John Clay
Bought by
Thompson Ana
Home Financials for this Owner
Home Financials are based on the most recent Mortgage that was taken out on this home.
Original Mortgage
$668,000
Interest Rate
5%
Mortgage Type
New Conventional
Purchase Details
Closed on
Aug 1, 1996
Sold by
Brandon Rosemary V
Bought by
Brandon Rosemary
Create a Home Valuation Report for This Property
The Home Valuation Report is an in-depth analysis detailing your home's value as well as a comparison with similar homes in the area
Home Values in the Area
Average Home Value in this Area
Purchase History
| Date | Buyer | Sale Price | Title Company |
|---|---|---|---|
| Cosentino Christopher | $698,000 | Chicago Title Company | |
| Thompson Ana | -- | Fidelity National Title Co | |
| Thompson Ana | $835,000 | Fidelity National Title Co | |
| Brandon Rosemary | -- | -- |
Source: Public Records
Mortgage History
| Date | Status | Borrower | Loan Amount |
|---|---|---|---|
| Open | Cosentino Christopher | $558,000 | |
| Previous Owner | Thompson Ana | $668,000 |
Source: Public Records
Tax History Compared to Growth
Tax History
| Year | Tax Paid | Tax Assessment Tax Assessment Total Assessment is a certain percentage of the fair market value that is determined by local assessors to be the total taxable value of land and additions on the property. | Land | Improvement |
|---|---|---|---|---|
| 2025 | $13,712 | $1,132,348 | $526,022 | $606,326 |
| 2024 | $13,712 | $1,110,146 | $515,708 | $594,438 |
| 2023 | $13,501 | $1,088,384 | $505,598 | $582,786 |
| 2022 | $13,238 | $1,067,048 | $495,686 | $571,362 |
| 2021 | $13,001 | $1,046,130 | $485,968 | $560,162 |
| 2020 | $11,873 | $935,908 | $480,986 | $454,922 |
| 2019 | $10,789 | $860,208 | $471,556 | $388,652 |
| 2018 | $10,425 | $843,342 | $462,310 | $381,032 |
| 2017 | $9,165 | $755,408 | $453,246 | $302,162 |
| 2016 | $9,003 | $740,598 | $444,360 | $296,238 |
| 2015 | $8,889 | $729,476 | $437,686 | $291,790 |
| 2014 | $8,654 | $715,190 | $429,114 | $286,076 |
Source: Public Records
Map
Nearby Homes
- 517 Ortega St
- 1851 10th Ave
- 1810 8th Ave
- 1808 8th Ave Unit 1810
- 118 Ortega St Unit 1200
- 455 Warren Dr
- 1885 16th Ave
- 1983 10th Ave
- 512 Judah St
- 113 193 Warren Dr
- 620 Pacheco St
- 302 Warren Dr
- 1650 19th Ave
- 1646 19th Ave
- 327 Crestmont Dr Unit 329
- 329 Crestmont Dr
- 1815 18th Ave
- 1983 15th Ave
- 1360 9th Ave Unit 7
- 1822 19th Ave Unit 1