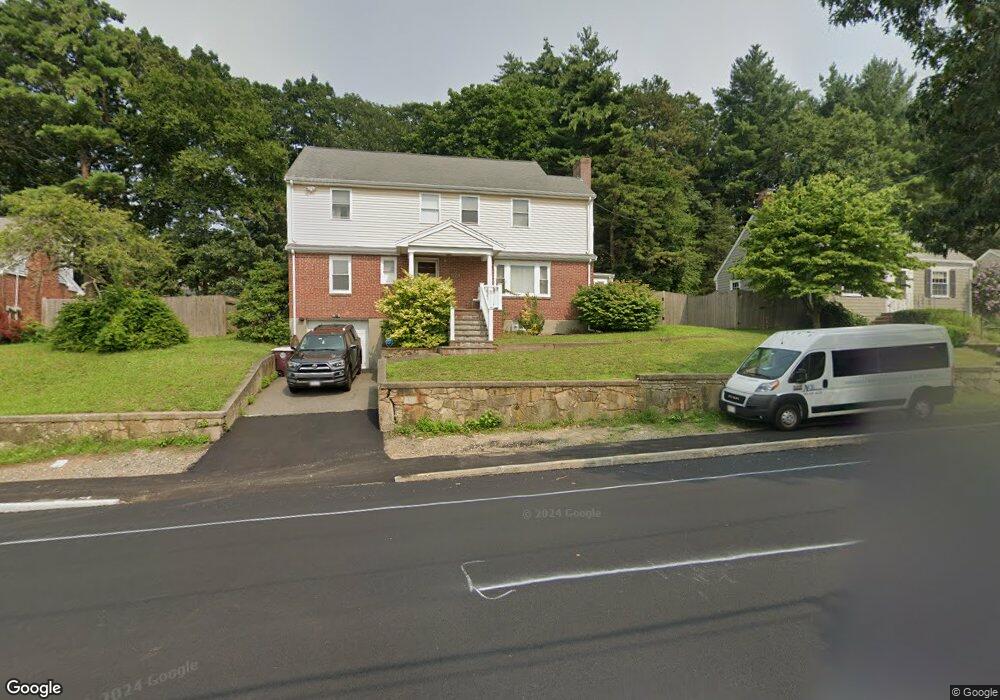
524 Summer St Weymouth, MA 02188
South Weymouth NeighborhoodEstimated Value: $630,000 - $739,000
4
Beds
2
Baths
2,197
Sq Ft
$303/Sq Ft
Est. Value
About This Home
This home is located at 524 Summer St, Weymouth, MA 02188 and is currently estimated at $666,695, approximately $303 per square foot. 524 Summer St is a home located in Norfolk County with nearby schools including Frederick C Murphy, Abigail Adams Middle School, and Weymouth Middle School Chapman.
Ownership History
Date
Name
Owned For
Owner Type
Purchase Details
Closed on
Jun 30, 2000
Sold by
Stordy Raymond J and Stordy Mary J
Bought by
Dudley Thomas M and Dudley Barbara A
Current Estimated Value
Home Financials for this Owner
Home Financials are based on the most recent Mortgage that was taken out on this home.
Original Mortgage
$192,414
Outstanding Balance
$70,606
Interest Rate
8.59%
Mortgage Type
Purchase Money Mortgage
Estimated Equity
$596,089
Create a Home Valuation Report for This Property
The Home Valuation Report is an in-depth analysis detailing your home's value as well as a comparison with similar homes in the area
Home Values in the Area
Average Home Value in this Area
Purchase History
| Date | Buyer | Sale Price | Title Company |
|---|---|---|---|
| Dudley Thomas M | $194,000 | -- |
Source: Public Records
Mortgage History
| Date | Status | Borrower | Loan Amount |
|---|---|---|---|
| Open | Dudley Thomas M | $192,414 | |
| Previous Owner | Dudley Thomas M | $32,500 | |
| Previous Owner | Dudley Thomas M | $40,000 |
Source: Public Records
Tax History Compared to Growth
Tax History
| Year | Tax Paid | Tax Assessment Tax Assessment Total Assessment is a certain percentage of the fair market value that is determined by local assessors to be the total taxable value of land and additions on the property. | Land | Improvement |
|---|---|---|---|---|
| 2025 | $5,555 | $550,000 | $204,700 | $345,300 |
| 2024 | $5,216 | $507,900 | $195,000 | $312,900 |
| 2023 | $4,898 | $468,700 | $180,500 | $288,200 |
| 2022 | $4,767 | $416,000 | $167,200 | $248,800 |
| 2021 | $4,793 | $408,300 | $167,200 | $241,100 |
| 2020 | $4,702 | $394,500 | $167,200 | $227,300 |
| 2019 | $4,586 | $378,400 | $160,700 | $217,700 |
| 2018 | $4,520 | $361,600 | $153,100 | $208,500 |
| 2017 | $4,413 | $344,500 | $145,800 | $198,700 |
| 2016 | $4,241 | $331,300 | $140,200 | $191,100 |
| 2015 | $4,125 | $319,800 | $140,200 | $179,600 |
| 2014 | $3,951 | $297,100 | $130,500 | $166,600 |
Source: Public Records
Map
Nearby Homes
- 116 Belmont St
- 501 Commerce Dr Unit 2310
- 501 Commerce Dr Unit 1111
- 501 Commerce Dr Unit 4206
- 501 Commerce Dr Unit 4308
- 501 Commerce Dr Unit 4306
- 655 Summer St
- 200 Justin Dr Unit 3
- 255 West St
- 262 West St
- 92 Mercury St
- 432 Grove St
- 441 Grove St
- 48 Apple Tree Ln
- 972 Liberty St
- 67 Abby Rd
- 54 Federal St
- 24 Blake Rd
- 2 Tara Dr Unit 1
- 308 Forest St