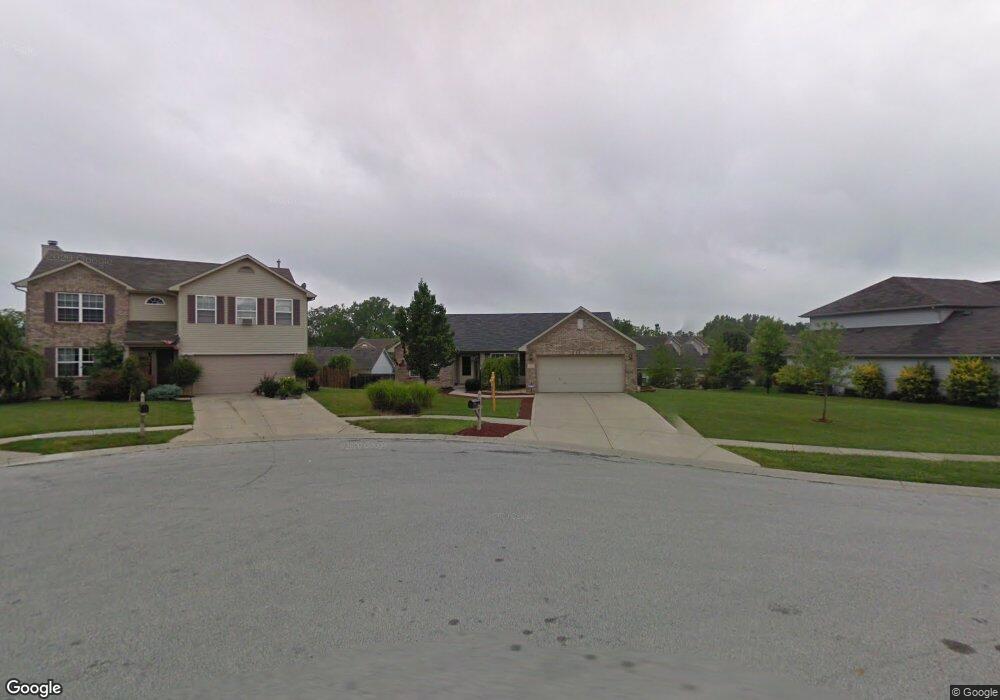
524 Timbrook Cir Beech Grove, IN 46107
Estimated Value: $264,774 - $300,000
3
Beds
2
Baths
1,185
Sq Ft
$237/Sq Ft
Est. Value
About This Home
This home is located at 524 Timbrook Cir, Beech Grove, IN 46107 and is currently estimated at $280,944, approximately $237 per square foot. 524 Timbrook Cir is a home located in Marion County with nearby schools including Hornet Park Elementary School, South Grove Intermediate School, and Central Elementary School.
Ownership History
Date
Name
Owned For
Owner Type
Purchase Details
Closed on
Apr 18, 2022
Sold by
Bartholomew Sue E
Bought by
Bartholomew Michael L and Bartholomew Sue E
Current Estimated Value
Home Financials for this Owner
Home Financials are based on the most recent Mortgage that was taken out on this home.
Original Mortgage
$167,000
Outstanding Balance
$156,717
Interest Rate
4.16%
Mortgage Type
New Conventional
Estimated Equity
$124,227
Purchase Details
Closed on
Nov 25, 2009
Sold by
Delong Jean M
Bought by
Bartholomew Sue E
Home Financials for this Owner
Home Financials are based on the most recent Mortgage that was taken out on this home.
Original Mortgage
$113,898
Interest Rate
5.05%
Mortgage Type
FHA
Create a Home Valuation Report for This Property
The Home Valuation Report is an in-depth analysis detailing your home's value as well as a comparison with similar homes in the area
Home Values in the Area
Average Home Value in this Area
Purchase History
| Date | Buyer | Sale Price | Title Company |
|---|---|---|---|
| Bartholomew Michael L | -- | Mvp National Title | |
| Bartholomew Sue E | -- | None Available |
Source: Public Records
Mortgage History
| Date | Status | Borrower | Loan Amount |
|---|---|---|---|
| Open | Bartholomew Michael L | $167,000 | |
| Previous Owner | Bartholomew Sue E | $113,898 |
Source: Public Records
Tax History Compared to Growth
Tax History
| Year | Tax Paid | Tax Assessment Tax Assessment Total Assessment is a certain percentage of the fair market value that is determined by local assessors to be the total taxable value of land and additions on the property. | Land | Improvement |
|---|---|---|---|---|
| 2024 | $2,748 | $218,100 | $29,600 | $188,500 |
| 2023 | $2,748 | $219,100 | $29,600 | $189,500 |
| 2022 | $2,519 | $198,100 | $29,600 | $168,500 |
| 2021 | $1,995 | $157,700 | $29,600 | $128,100 |
| 2020 | $1,966 | $154,800 | $29,600 | $125,200 |
| 2019 | $1,843 | $145,300 | $25,500 | $119,800 |
| 2018 | $1,672 | $134,200 | $25,500 | $108,700 |
| 2017 | $1,656 | $132,900 | $25,500 | $107,400 |
| 2016 | $1,648 | $132,200 | $25,500 | $106,700 |
| 2014 | $1,380 | $119,400 | $25,500 | $93,900 |
| 2013 | $1,360 | $118,400 | $25,500 | $92,900 |
Source: Public Records
Map
Nearby Homes
- 3731 Owster Ln
- 3611 Owster Ln
- 508 S 9th Ave
- 227 S 12th Ave
- 3830 S Olney St
- 4235 Foxglove Trace
- 847 Churchman Ave
- 602 Memorial Dr
- 4219 Terra Dr
- 1121 Alton St
- 402 Cherry St
- 4261 Foxglove Trace
- 619 Byland Dr
- 216 S 7th Ave
- 76 S 11th Ave
- 631 Memorial Dr
- 619 Memorial Dr
- 1995 Britton Dr
- 725 S 4th Ave
- 30 Gilbert Ave
- 524 Timbrook Cir
- 518 Timbrook Cir
- 530 Timbrook Cir
- 515 Charnwood Pkwy
- 509 Charnwood Pkwy
- 521 Charnwood Pkwy
- 1329 Timbrook Ln
- 536 Timbrook Cir
- 1311 Timbrook Ln
- 523 Timbrook Cir
- 527 Charnwood Pkwy
- 529 Timbrook Cir
- 539 Timbrook Cir
- 517 Timbrook Cir
- 535 Timbrook Cir
- 1237 Timbrook Ln
- 1306 Middleham Ln
- 516 Charnwood Pkwy
- 1246 Middleham Ln
- 510 Charnwood Pkwy