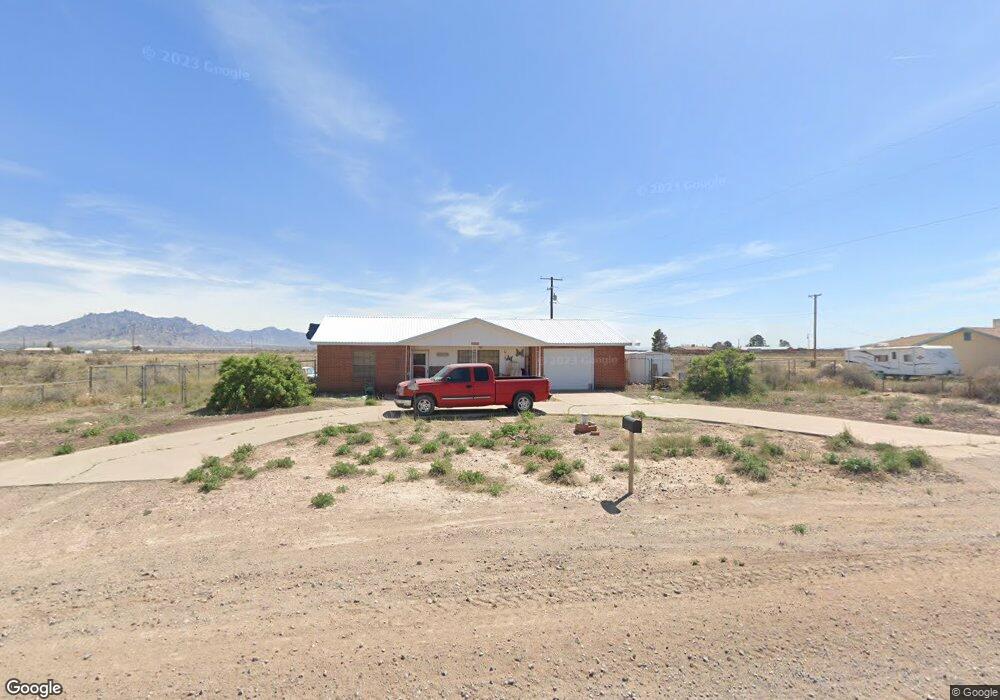
5240 Carlota Rd SE Deming, NM 88030
Estimated Value: $161,432 - $195,000
--
Bed
--
Bath
--
Sq Ft
0.5
Acres
About This Home
This home is located at 5240 Carlota Rd SE, Deming, NM 88030 and is currently estimated at $176,608. 5240 Carlota Rd SE is a home located in Luna County with nearby schools including Chaparral Elementary School, Deming Intermediate School, and Red Mountain Middle School.
Ownership History
Date
Name
Owned For
Owner Type
Purchase Details
Closed on
Jun 22, 2016
Sold by
Marilyn Peterson
Bought by
Hensley Merline Sarah and Hensley Thomas Nolan
Current Estimated Value
Home Financials for this Owner
Home Financials are based on the most recent Mortgage that was taken out on this home.
Original Mortgage
$3
Outstanding Balance
$2
Interest Rate
3.64%
Mortgage Type
Purchase Money Mortgage
Estimated Equity
$176,606
Purchase Details
Closed on
Aug 28, 2015
Sold by
Alberta Mcgee Inervivos Trust
Bought by
Marilyn Peterson Estate and Merlin Mcgee Estate
Home Financials for this Owner
Home Financials are based on the most recent Mortgage that was taken out on this home.
Original Mortgage
$3
Interest Rate
3.64%
Mortgage Type
Purchase Money Mortgage
Purchase Details
Closed on
Feb 7, 2012
Sold by
Trust Of Alberta Mcgee
Bought by
Mcgee Raymon
Create a Home Valuation Report for This Property
The Home Valuation Report is an in-depth analysis detailing your home's value as well as a comparison with similar homes in the area
Home Values in the Area
Average Home Value in this Area
Purchase History
| Date | Buyer | Sale Price | Title Company |
|---|---|---|---|
| Hensley Merline Sarah | -- | Mimbres Valley Abstract & Ti | |
| Marilyn Peterson Estate | -- | None Available | |
| Mcgee Raymon | -- | -- |
Source: Public Records
Mortgage History
| Date | Status | Borrower | Loan Amount |
|---|---|---|---|
| Open | Hensley Merline Sarah | $3 | |
| Previous Owner | Marilyn Peterson Estate | $3 |
Source: Public Records
Tax History Compared to Growth
Tax History
| Year | Tax Paid | Tax Assessment Tax Assessment Total Assessment is a certain percentage of the fair market value that is determined by local assessors to be the total taxable value of land and additions on the property. | Land | Improvement |
|---|---|---|---|---|
| 2025 | $666 | $33,074 | $7,295 | $25,779 |
| 2024 | $665 | $32,112 | $7,083 | $25,029 |
| 2023 | $665 | $32,112 | $7,083 | $25,029 |
| 2022 | $656 | $32,112 | $7,083 | $25,029 |
| 2021 | $614 | $31,389 | $6,360 | $25,029 |
| 2020 | $614 | $30,445 | $5,416 | $25,029 |
| 2019 | $608 | $30,445 | $5,416 | $25,029 |
| 2018 | $567 | $28,695 | $3,666 | $25,029 |
| 2017 | $559 | $28,695 | $3,666 | $25,029 |
| 2016 | $535 | $27,046 | $2,017 | $25,029 |
| 2015 | $55,177 | $27,046 | $2,017 | $25,029 |
| 2014 | $55,177 | $27,511 | $2,016 | $25,495 |
Source: Public Records
Map
Nearby Homes
- XXX Tia Rita Rd SE
- TBD Lomita Rd Unit Block 6 Lot 4
- TBD Lomita Rd Unit Block 6 Lot 2
- TBD Lomita Rd Unit Block 6 Lot 1
- 0 Campana Rd SE
- 5715 San Felipe Rd SE
- 1890 El Portal Rd SE
- xxx San Isidro
- 0 Camila Rd SE Unit 20231415
- 1 Acre San Isidro Rd
- 0000 Amapola Rd SE
- 0 Amapola Rd SE Unit 20231659
- XXXX Lomita Rd Se Block 6 Lot 3
- TBD Grulla Mountain Rd SE Unit Block 2 Lot 5
- TBD Grulla Mountain Rd SE Unit Block 2 Lot 3
- TBD Grulla Mountain Rd SE Unit Block 2 Lot 4
- TBD Grulla Mountain Rd SE Unit Block 6 Lot 13
- TBD Grulla Mountain Rd SE Unit Block 6 Lot 11
- TBD Grulla Mountain Rd SE Unit Block 6 Lot 12
- TBD Grulla Mountain Rd SE Unit Block 7 Lot 3
- 5170 Carlota Rd SE
- 5220 San Felipe Rd SE
- 5335 Carlota Rd SE
- 5290 San Felipe Rd SE
- 5100 Carlota Rd SE
- 5165 Veranda Rd SE
- 5380 Tia Rita Rd SE
- 5215 Jasmine Rd SE
- 5045 Tia Rita Rd SE
- 5265 San Augustine Rd SE
- 2635 Tapia Rd SE
- 2715 Tapia Rd SE
- 2665 Tapia Rd SE
- 5280 San Isidro Rd SE
- 2555 Tapia Rd SE
- 5095 San Augustine Rd SE
- 0016 SE Jasmine
- 0 Unit 20 Dr Unit 20135438
- 5075 San Augustine Rd SE
- 5460 Veranda Rd SE