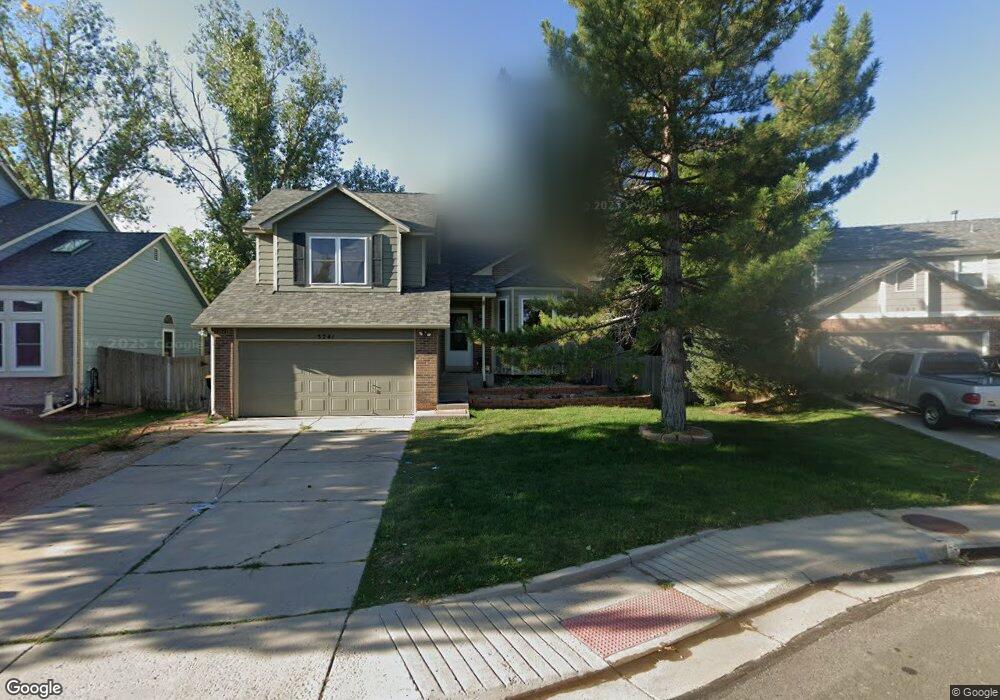
5241 E Prescott Ave Castle Rock, CO 80104
Founders Village NeighborhoodEstimated Value: $522,000 - $603,000
4
Beds
3
Baths
2,356
Sq Ft
$233/Sq Ft
Est. Value
About This Home
This home is located at 5241 E Prescott Ave, Castle Rock, CO 80104 and is currently estimated at $549,334, approximately $233 per square foot. 5241 E Prescott Ave is a home located in Douglas County with nearby schools including Rock Ridge Elementary School, Mesa Middle School, and Douglas County High School.
Ownership History
Date
Name
Owned For
Owner Type
Purchase Details
Closed on
Feb 26, 2019
Sold by
Allen Lonnie S
Bought by
Fleet Blake Tyler and Fleet Amy Alane
Current Estimated Value
Home Financials for this Owner
Home Financials are based on the most recent Mortgage that was taken out on this home.
Original Mortgage
$330,750
Outstanding Balance
$290,786
Interest Rate
4.4%
Mortgage Type
New Conventional
Estimated Equity
$258,548
Purchase Details
Closed on
Aug 16, 2013
Sold by
Deaner Joshua M and Deaner Emily F
Bought by
Allen Lonnie S
Home Financials for this Owner
Home Financials are based on the most recent Mortgage that was taken out on this home.
Original Mortgage
$248,953
Interest Rate
4.53%
Mortgage Type
VA
Purchase Details
Closed on
Nov 30, 2009
Sold by
Grant G Brad
Bought by
Deaner Joshua M and Deaner Emily F
Home Financials for this Owner
Home Financials are based on the most recent Mortgage that was taken out on this home.
Original Mortgage
$204,280
Interest Rate
5.06%
Mortgage Type
New Conventional
Purchase Details
Closed on
Sep 1, 2009
Sold by
Cox Kevin M and Norman Cox Joy P
Bought by
Grant G Brad
Purchase Details
Closed on
Dec 22, 2003
Sold by
Hulet Glade L
Bought by
Cox Kevin M and Norman Cox Joy P
Home Financials for this Owner
Home Financials are based on the most recent Mortgage that was taken out on this home.
Original Mortgage
$208,626
Interest Rate
5.86%
Mortgage Type
FHA
Purchase Details
Closed on
Jun 29, 2001
Sold by
Anguiano Jason M and Anguiano Gina R
Bought by
Hulet Glade L
Home Financials for this Owner
Home Financials are based on the most recent Mortgage that was taken out on this home.
Original Mortgage
$189,525
Interest Rate
7.18%
Mortgage Type
FHA
Purchase Details
Closed on
Feb 12, 1997
Sold by
Nurse Michelle M
Bought by
Anguiano Jason M and Anguiano Gina R
Home Financials for this Owner
Home Financials are based on the most recent Mortgage that was taken out on this home.
Original Mortgage
$132,900
Interest Rate
7.88%
Purchase Details
Closed on
Jul 10, 1996
Sold by
Mcguire Daniel L and Mcguire Susan G
Bought by
Nurse Michelle M
Home Financials for this Owner
Home Financials are based on the most recent Mortgage that was taken out on this home.
Original Mortgage
$111,200
Interest Rate
7%
Purchase Details
Closed on
Oct 13, 1989
Sold by
Smith Glen R and Smith Janet I P
Bought by
Mcguire Daniel L and Mcguire Susan G
Purchase Details
Closed on
Sep 13, 1985
Sold by
Richmond Belmont Ltd
Bought by
Smith Glen R and Smith Janet I
Create a Home Valuation Report for This Property
The Home Valuation Report is an in-depth analysis detailing your home's value as well as a comparison with similar homes in the area
Home Values in the Area
Average Home Value in this Area
Purchase History
| Date | Buyer | Sale Price | Title Company |
|---|---|---|---|
| Fleet Blake Tyler | $367,500 | First American Title | |
| Allen Lonnie S | $241,000 | Chicago Title Co | |
| Deaner Joshua M | $205,000 | Land Title Guarantee Company | |
| Grant G Brad | -- | None Available | |
| Cox Kevin M | $211,900 | -- | |
| Hulet Glade L | $192,500 | -- | |
| Anguiano Jason M | $139,900 | -- | |
| Nurse Michelle M | $139,000 | Land Title | |
| Mcguire Daniel L | $96,000 | -- | |
| Smith Glen R | $92,400 | -- |
Source: Public Records
Mortgage History
| Date | Status | Borrower | Loan Amount |
|---|---|---|---|
| Open | Fleet Blake Tyler | $330,750 | |
| Previous Owner | Allen Lonnie S | $248,953 | |
| Previous Owner | Deaner Joshua M | $204,280 | |
| Previous Owner | Cox Kevin M | $208,626 | |
| Previous Owner | Hulet Glade L | $189,525 | |
| Previous Owner | Anguiano Jason M | $132,900 | |
| Previous Owner | Nurse Michelle M | $111,200 |
Source: Public Records
Tax History Compared to Growth
Tax History
| Year | Tax Paid | Tax Assessment Tax Assessment Total Assessment is a certain percentage of the fair market value that is determined by local assessors to be the total taxable value of land and additions on the property. | Land | Improvement |
|---|---|---|---|---|
| 2024 | $5,779 | $38,870 | $7,610 | $31,260 |
| 2023 | $5,813 | $38,870 | $7,610 | $31,260 |
| 2022 | $4,251 | $26,850 | $5,640 | $21,210 |
| 2021 | $4,330 | $26,850 | $5,640 | $21,210 |
| 2020 | $4,059 | $25,910 | $4,570 | $21,340 |
| 2019 | $4,061 | $25,910 | $4,570 | $21,340 |
| 2018 | $3,484 | $22,060 | $3,930 | $18,130 |
| 2017 | $3,354 | $22,060 | $3,930 | $18,130 |
| 2016 | $2,889 | $19,840 | $3,840 | $16,000 |
| 2015 | $2,926 | $19,840 | $3,840 | $16,000 |
| 2014 | $1,208 | $15,730 | $3,420 | $12,310 |
Source: Public Records
Map
Nearby Homes
- 650 Howe Cir
- 535 Howe St
- 612 Blue Teal Dr
- 364 N Willow St
- 5326 E Howe St
- 5521 Spruce Ave
- 718 Blue Teal Dr
- 5323 E Sandpiper Ave
- 613 N Brentwood Ct
- 950 Sundown Dr
- 5617 E Prescott Ave
- 330 N Wagonwheel Trail
- 5939 Still Meadow Place
- 5938 Still Meadow Place
- 109 N Quicksilver Ave
- 5086 Basalt Ridge Cir
- 1273 N Heritage Ave
- 176 S Pembrook St
- 1255 Basalt Ridge Loop
- 157 S Quicksilver Ave
- 5303 E Prescott Ave
- 5237 E Prescott Ave
- 5307 E Prescott Ave
- 5233 E Prescott Ave
- 5302 E Prescott Ave
- 5229 E Prescott Ave
- 5311 E Prescott Ave
- 5306 E Prescott Ave
- 5317 E Spruce Ave
- 5337 E Spruce Ave
- 5297 E Spruce Ave
- 5225 E Prescott Ave
- 5357 E Spruce Ave
- 5310 E Prescott Ave
- 5315 E Prescott Ave
- 5224 E Prescott Ave
- 5377 E Spruce Ave
- 5287 E Spruce Ave
- 5221 E Prescott Ave
- 5314 E Prescott Ave