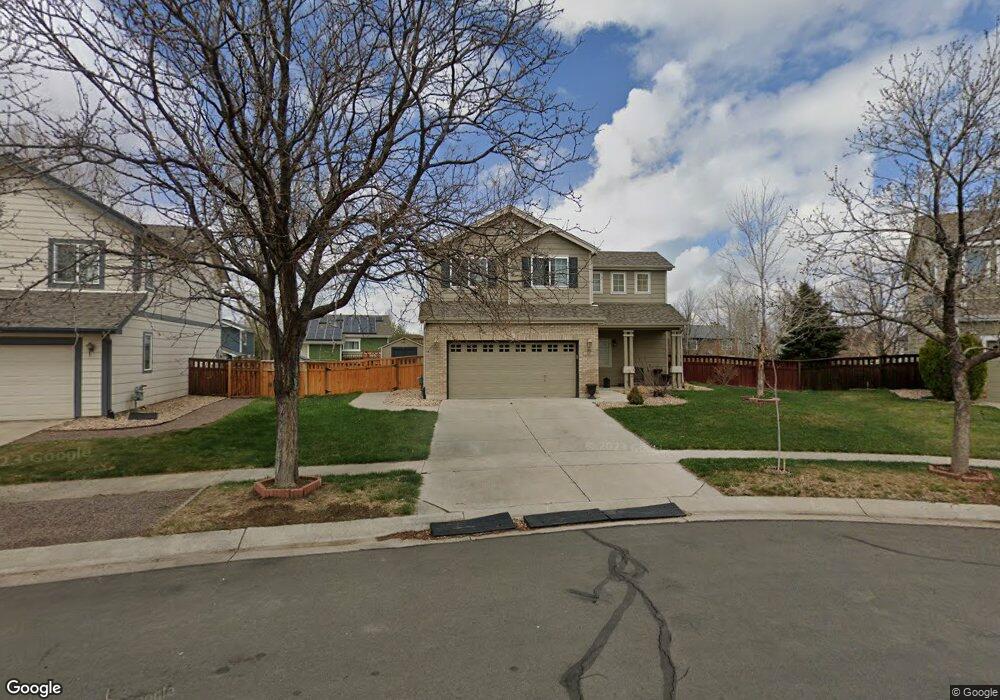
5241 Grey Swallow St Brighton, CO 80601
Estimated Value: $421,000 - $446,131
3
Beds
3
Baths
1,421
Sq Ft
$308/Sq Ft
Est. Value
About This Home
This home is located at 5241 Grey Swallow St, Brighton, CO 80601 and is currently estimated at $437,533, approximately $307 per square foot. 5241 Grey Swallow St is a home located in Adams County with nearby schools including Pennock Elementary School, Overland Trail Middle School, and Brighton High School.
Ownership History
Date
Name
Owned For
Owner Type
Purchase Details
Closed on
May 29, 2020
Sold by
Cecil Kristy A
Bought by
Gray Giulianna
Current Estimated Value
Home Financials for this Owner
Home Financials are based on the most recent Mortgage that was taken out on this home.
Original Mortgage
$286,150
Outstanding Balance
$254,123
Interest Rate
3.3%
Mortgage Type
New Conventional
Estimated Equity
$183,410
Purchase Details
Closed on
Aug 31, 2005
Sold by
Baker Roger J and Baker Aleta K
Bought by
Cecil Kristy A
Home Financials for this Owner
Home Financials are based on the most recent Mortgage that was taken out on this home.
Original Mortgage
$203,278
Interest Rate
5.81%
Mortgage Type
VA
Purchase Details
Closed on
Dec 20, 1999
Sold by
Richmond American Homes Of Colorado Inc
Bought by
Baker Roger J and Baker Aleta K
Home Financials for this Owner
Home Financials are based on the most recent Mortgage that was taken out on this home.
Original Mortgage
$126,750
Interest Rate
7.69%
Create a Home Valuation Report for This Property
The Home Valuation Report is an in-depth analysis detailing your home's value as well as a comparison with similar homes in the area
Home Values in the Area
Average Home Value in this Area
Purchase History
| Date | Buyer | Sale Price | Title Company |
|---|---|---|---|
| Gray Giulianna | $295,000 | None Available | |
| Cecil Kristy A | $200,000 | North Amer Title Co Of Co | |
| Baker Roger J | $158,670 | Land Title |
Source: Public Records
Mortgage History
| Date | Status | Borrower | Loan Amount |
|---|---|---|---|
| Open | Gray Giulianna | $286,150 | |
| Previous Owner | Cecil Kristy A | $203,278 | |
| Previous Owner | Baker Roger J | $126,750 |
Source: Public Records
Tax History Compared to Growth
Tax History
| Year | Tax Paid | Tax Assessment Tax Assessment Total Assessment is a certain percentage of the fair market value that is determined by local assessors to be the total taxable value of land and additions on the property. | Land | Improvement |
|---|---|---|---|---|
| 2024 | $4,479 | $25,820 | $5,940 | $19,880 |
| 2023 | $4,462 | $29,900 | $6,430 | $23,470 |
| 2022 | $3,832 | $22,120 | $5,910 | $16,210 |
| 2021 | $3,695 | $22,120 | $5,910 | $16,210 |
| 2020 | $3,569 | $22,230 | $5,790 | $16,440 |
| 2019 | $3,574 | $22,230 | $5,790 | $16,440 |
| 2018 | $3,147 | $19,540 | $6,480 | $13,060 |
| 2017 | $3,150 | $19,540 | $6,480 | $13,060 |
| 2016 | $2,050 | $13,140 | $3,180 | $9,960 |
| 2015 | $2,041 | $13,140 | $3,180 | $9,960 |
| 2014 | $1,702 | $11,040 | $2,630 | $8,410 |
Source: Public Records
Map
Nearby Homes
- 5113 Grey Swallow St
- 5157 Goshawk St
- 4950 Mount Cameron Dr
- 5224 Snow Goose St
- 33 Gaviota Ave
- 5055 Pelican St
- 5292 Goldfinch St
- 5092 Sparrow St
- 4828 Mount Cameron Dr
- 102 Pelican Ave
- 5624 Killdeer St Unit 5624
- 4749 Mount Shavano St
- 12 Golden Eagle Pkwy Unit 12
- 4670 Quandary Peak St
- 4723 Crestone Peak St
- 4641 Quandary Peak St
- 4589 Quandary Peak St
- 4591 Crestone Peak St
- 5161 Chicory Cir
- 329 Apache Plume St
- 5231 Grey Swallow St
- 5251 Grey Swallow St
- 5258 Nighthawk Pkwy
- 5278 Nighthawk Pkwy
- 5221 Grey Swallow St
- 5238 Nighthawk Pkwy
- 5288 Nighthawk Pkwy
- 5261 Grey Swallow St
- 5228 Nighthawk Pkwy
- 454 Crane St
- 474 Crane St
- 5211 Grey Swallow St
- 5271 Grey Swallow St
- 419 Longspur Dr
- 5218 Nighthawk Pkwy
- 409 Longspur Dr
- 5281 Grey Swallow St
- 407 Longspur Dr
- 429 Longspur Dr
- 5387 Golden Eagle Pkwy