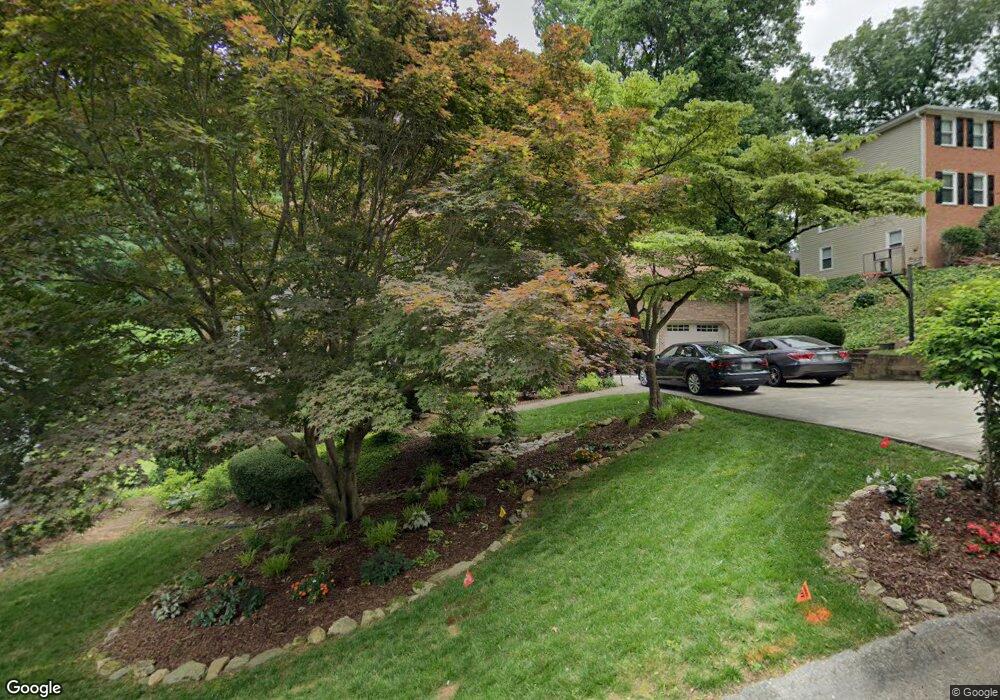
5242 Pikes Peak Ct Marietta, GA 30062
East Cobb NeighborhoodEstimated Value: $725,949 - $779,000
4
Beds
3
Baths
3,225
Sq Ft
$233/Sq Ft
Est. Value
About This Home
This home is located at 5242 Pikes Peak Ct, Marietta, GA 30062 and is currently estimated at $750,237, approximately $232 per square foot. 5242 Pikes Peak Ct is a home located in Cobb County with nearby schools including Timber Ridge Elementary School, Dodgen Middle School, and Walton High School.
Ownership History
Date
Name
Owned For
Owner Type
Purchase Details
Closed on
Oct 2, 2009
Sold by
Labdroche Jerry B
Bought by
Landroche Jerry B and Landroche Kelly
Current Estimated Value
Home Financials for this Owner
Home Financials are based on the most recent Mortgage that was taken out on this home.
Original Mortgage
$272,000
Outstanding Balance
$177,072
Interest Rate
5.1%
Mortgage Type
New Conventional
Estimated Equity
$573,165
Purchase Details
Closed on
Mar 16, 2007
Sold by
Delaney Jeffrey R and Delaney Julie A
Bought by
Linskey Todd D and Linskey Kathryn A
Home Financials for this Owner
Home Financials are based on the most recent Mortgage that was taken out on this home.
Original Mortgage
$200,000
Interest Rate
6.3%
Mortgage Type
New Conventional
Create a Home Valuation Report for This Property
The Home Valuation Report is an in-depth analysis detailing your home's value as well as a comparison with similar homes in the area
Home Values in the Area
Average Home Value in this Area
Purchase History
| Date | Buyer | Sale Price | Title Company |
|---|---|---|---|
| Landroche Jerry B | $340,000 | -- | |
| Landroche Jerry B | $340,000 | -- | |
| Linskey Todd D | $330,000 | -- |
Source: Public Records
Mortgage History
| Date | Status | Borrower | Loan Amount |
|---|---|---|---|
| Open | Landroche Jerry B | $272,000 | |
| Previous Owner | Linskey Todd D | $200,000 |
Source: Public Records
Tax History Compared to Growth
Tax History
| Year | Tax Paid | Tax Assessment Tax Assessment Total Assessment is a certain percentage of the fair market value that is determined by local assessors to be the total taxable value of land and additions on the property. | Land | Improvement |
|---|---|---|---|---|
| 2025 | $6,579 | $269,660 | $62,000 | $207,660 |
| 2024 | $6,585 | $269,660 | $62,000 | $207,660 |
| 2023 | $4,979 | $220,648 | $37,600 | $183,048 |
| 2022 | $4,746 | $183,308 | $37,600 | $145,708 |
| 2021 | $4,484 | $171,308 | $37,600 | $133,708 |
| 2020 | $4,484 | $171,308 | $37,600 | $133,708 |
| 2019 | $4,484 | $171,308 | $37,600 | $133,708 |
| 2018 | $4,051 | $151,560 | $36,000 | $115,560 |
| 2017 | $3,881 | $151,560 | $36,000 | $115,560 |
| 2016 | $3,461 | $132,344 | $32,800 | $99,544 |
| 2015 | $3,428 | $127,132 | $22,000 | $105,132 |
| 2014 | $3,456 | $127,132 | $0 | $0 |
Source: Public Records
Map
Nearby Homes
- 5250 Pikes Peak Ct
- 2255 Rushmore Dr
- 2212 Heritage Trace View
- 2655 Boulder Creek Dr NE
- 1929 Fields Pond Glen
- 2482 N Forest Dr
- 1009 Lake Pointe Cir
- 3113 Lake Pointe Cir
- 4013 Lake Pointe Cir Unit 4013
- 3210 Lake Pointe Cir
- 2066 Old Forge Way
- 2039 Old Forge Way
- 1961 Fields Pond Dr
- 110 Boulder Dr
- 2743 Chimney Springs Dr
- 2661 Sandpoint Way NE
- 2696 Long Lake Terrace NE
- 5240 Pikes Peak Ct
- 5244 Pikes Peak Ct
- 5246 Pikes Peak Ct
- 5245 Pikes Peak Ct
- 5243 Pikes Peak Ct
- 5231 Shasta Way
- 5234 Pikes Peak Ct
- 5232 Pikes Peak Ct
- 5247 Pikes Peak Ct
- 5230 Pikes Peak Ct
- 5241 Pikes Peak Ct
- 5233 Shasta Way
- 5230 Shasta Way
- 5248 Pikes Peak Ct
- 5249 Pikes Peak Ct
- 5228 Pikes Peak Ct
- 5239 Pikes Peak Ct
- 5226 Pikes Peak Ct
- 2259 N Forest Dr
- 2265 N Forest Dr