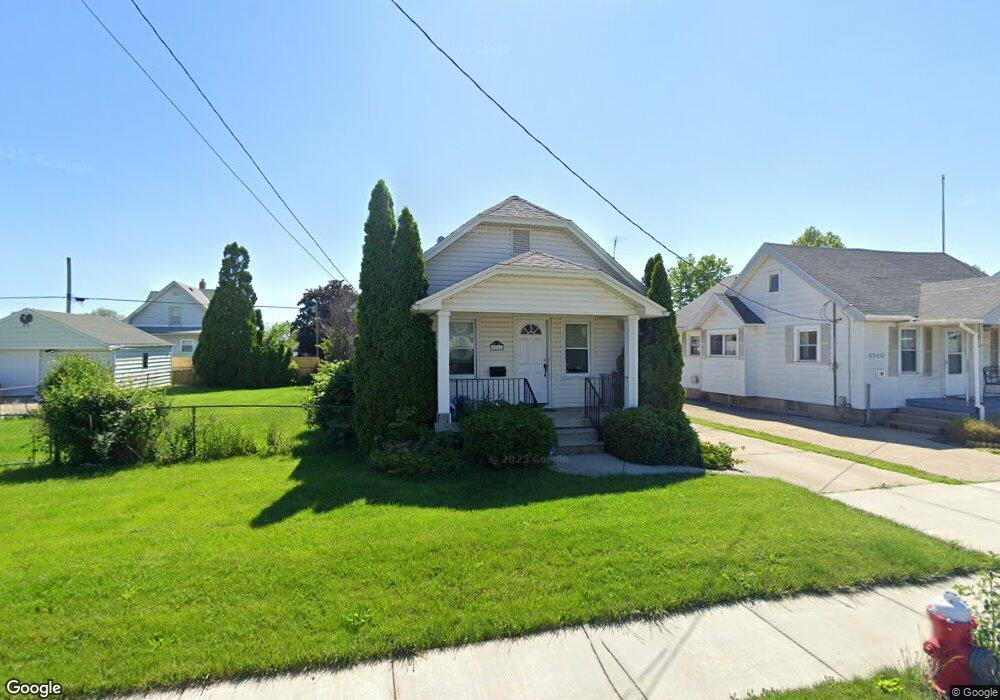
5244 302nd St Toledo, OH 43611
Point Place NeighborhoodEstimated Value: $122,816 - $140,000
2
Beds
1
Bath
984
Sq Ft
$133/Sq Ft
Est. Value
About This Home
This home is located at 5244 302nd St, Toledo, OH 43611 and is currently estimated at $130,954, approximately $133 per square foot. 5244 302nd St is a home located in Lucas County with nearby schools including Edgewater Elementary School, Woodward High School, and Imagine Environmental Science Academy.
Ownership History
Date
Name
Owned For
Owner Type
Purchase Details
Closed on
Jul 29, 2011
Sold by
Adams Martin
Bought by
Heck Apryl M
Current Estimated Value
Home Financials for this Owner
Home Financials are based on the most recent Mortgage that was taken out on this home.
Original Mortgage
$52,631
Outstanding Balance
$36,616
Interest Rate
4.75%
Mortgage Type
FHA
Estimated Equity
$94,338
Purchase Details
Closed on
Dec 3, 2002
Sold by
Adams David W
Bought by
Adams David W and David W Adams Living Trust
Purchase Details
Closed on
Nov 9, 1992
Sold by
Lacourse Theodore L
Create a Home Valuation Report for This Property
The Home Valuation Report is an in-depth analysis detailing your home's value as well as a comparison with similar homes in the area
Home Values in the Area
Average Home Value in this Area
Purchase History
| Date | Buyer | Sale Price | Title Company |
|---|---|---|---|
| Heck Apryl M | $54,000 | Chicago Title | |
| Adams David W | -- | -- | |
| -- | $43,400 | -- |
Source: Public Records
Mortgage History
| Date | Status | Borrower | Loan Amount |
|---|---|---|---|
| Open | Heck Apryl M | $52,631 |
Source: Public Records
Tax History Compared to Growth
Tax History
| Year | Tax Paid | Tax Assessment Tax Assessment Total Assessment is a certain percentage of the fair market value that is determined by local assessors to be the total taxable value of land and additions on the property. | Land | Improvement |
|---|---|---|---|---|
| 2024 | $926 | $28,840 | $8,015 | $20,825 |
| 2023 | $1,603 | $23,625 | $7,280 | $16,345 |
| 2022 | $1,604 | $23,625 | $7,280 | $16,345 |
| 2021 | $1,633 | $23,625 | $7,280 | $16,345 |
| 2020 | $1,559 | $19,530 | $6,020 | $13,510 |
| 2019 | $1,509 | $19,530 | $6,020 | $13,510 |
| 2018 | $1,558 | $19,530 | $6,020 | $13,510 |
| 2017 | $1,593 | $19,705 | $5,740 | $13,965 |
| 2016 | $1,605 | $56,300 | $16,400 | $39,900 |
| 2015 | $1,594 | $56,300 | $16,400 | $39,900 |
| 2014 | $1,240 | $19,710 | $5,740 | $13,970 |
| 2013 | $1,240 | $19,710 | $5,740 | $13,970 |
Source: Public Records
Map
Nearby Homes