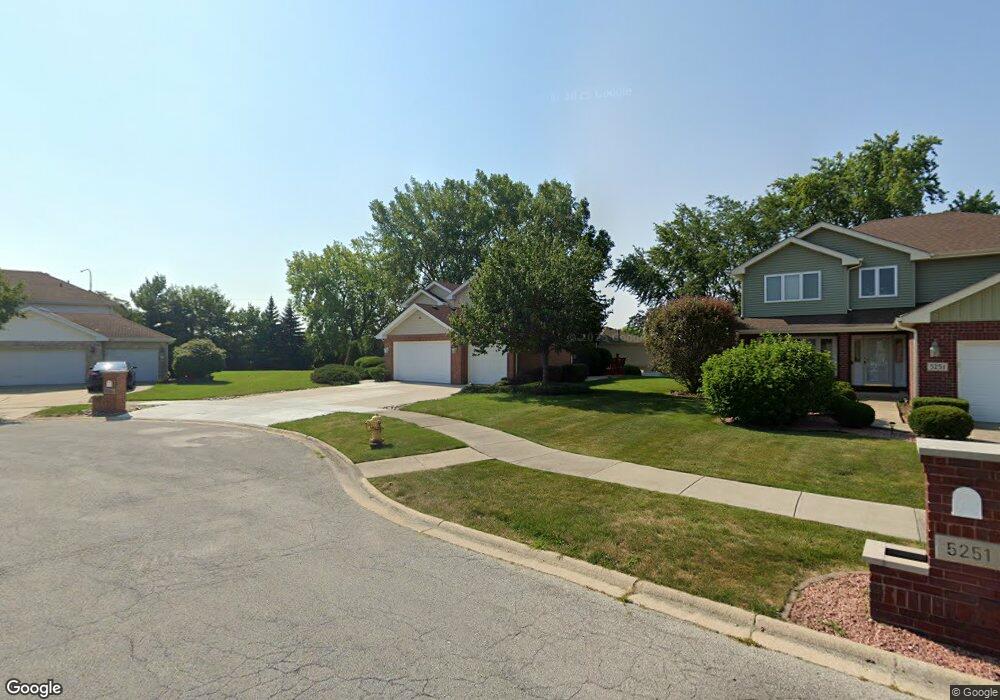
5245 Stanford Ln Matteson, IL 60443
West Matteson NeighborhoodEstimated Value: $334,000 - $376,000
4
Beds
3
Baths
2,540
Sq Ft
$138/Sq Ft
Est. Value
About This Home
This home is located at 5245 Stanford Ln, Matteson, IL 60443 and is currently estimated at $351,487, approximately $138 per square foot. 5245 Stanford Ln is a home located in Cook County with nearby schools including Colin Powell Middle School.
Ownership History
Date
Name
Owned For
Owner Type
Purchase Details
Closed on
Oct 31, 2009
Sold by
Giles Virgil and Giles Kelly
Bought by
Wade Byrd Dorette and Byrd Roosevelt
Current Estimated Value
Home Financials for this Owner
Home Financials are based on the most recent Mortgage that was taken out on this home.
Original Mortgage
$217,979
Outstanding Balance
$141,602
Interest Rate
4.9%
Mortgage Type
FHA
Estimated Equity
$209,885
Purchase Details
Closed on
Feb 26, 2001
Sold by
State Bank Of Countryside
Bought by
Giles Virgil and Giles Kelly
Home Financials for this Owner
Home Financials are based on the most recent Mortgage that was taken out on this home.
Original Mortgage
$212,560
Interest Rate
7.13%
Mortgage Type
FHA
Create a Home Valuation Report for This Property
The Home Valuation Report is an in-depth analysis detailing your home's value as well as a comparison with similar homes in the area
Home Values in the Area
Average Home Value in this Area
Purchase History
| Date | Buyer | Sale Price | Title Company |
|---|---|---|---|
| Wade Byrd Dorette | $222,000 | Pntn | |
| Giles Virgil | $220,500 | -- |
Source: Public Records
Mortgage History
| Date | Status | Borrower | Loan Amount |
|---|---|---|---|
| Open | Wade Byrd Dorette | $217,979 | |
| Previous Owner | Giles Virgil | $212,560 |
Source: Public Records
Tax History Compared to Growth
Tax History
| Year | Tax Paid | Tax Assessment Tax Assessment Total Assessment is a certain percentage of the fair market value that is determined by local assessors to be the total taxable value of land and additions on the property. | Land | Improvement |
|---|---|---|---|---|
| 2024 | $11,205 | $31,985 | $6,839 | $25,146 |
| 2023 | $8,174 | $33,000 | $6,839 | $26,161 |
| 2022 | $8,174 | $21,425 | $5,907 | $15,518 |
| 2021 | $8,338 | $21,423 | $5,906 | $15,517 |
| 2020 | $9,568 | $21,423 | $5,906 | $15,517 |
| 2019 | $8,216 | $18,467 | $5,284 | $13,183 |
| 2018 | $8,094 | $18,467 | $5,284 | $13,183 |
| 2017 | $7,901 | $18,467 | $5,284 | $13,183 |
| 2016 | $7,877 | $17,719 | $4,663 | $13,056 |
| 2015 | $9,099 | $20,530 | $4,663 | $15,867 |
| 2014 | $8,879 | $20,530 | $4,663 | $15,867 |
| 2013 | $9,003 | $22,200 | $4,663 | $17,537 |
Source: Public Records
Map
Nearby Homes
- 5345 Stanford Ln
- 856 Notre Dame Dr
- 340 Maryview Ct
- 322 Central Ave
- 5631 Colgate Ln
- 824 Dartmouth Ave
- 907 Dartmouth Ave
- 829 Princeton Ave
- 255 Central Ave
- 919 Dartmouth Ave
- 818 Princeton Ave
- 5522 Mallard Dr
- 222 Owen St
- 953 Dartmouth Ave
- 111 Echelon Cir
- 202 Owen St
- 948 Dartmouth Ave
- 192 Owen St
- 5290 Trinity Place
- 5629 Crestwood Rd