Estimated Value: $282,408 - $333,000
3
Beds
2
Baths
1,688
Sq Ft
$180/Sq Ft
Est. Value
About This Home
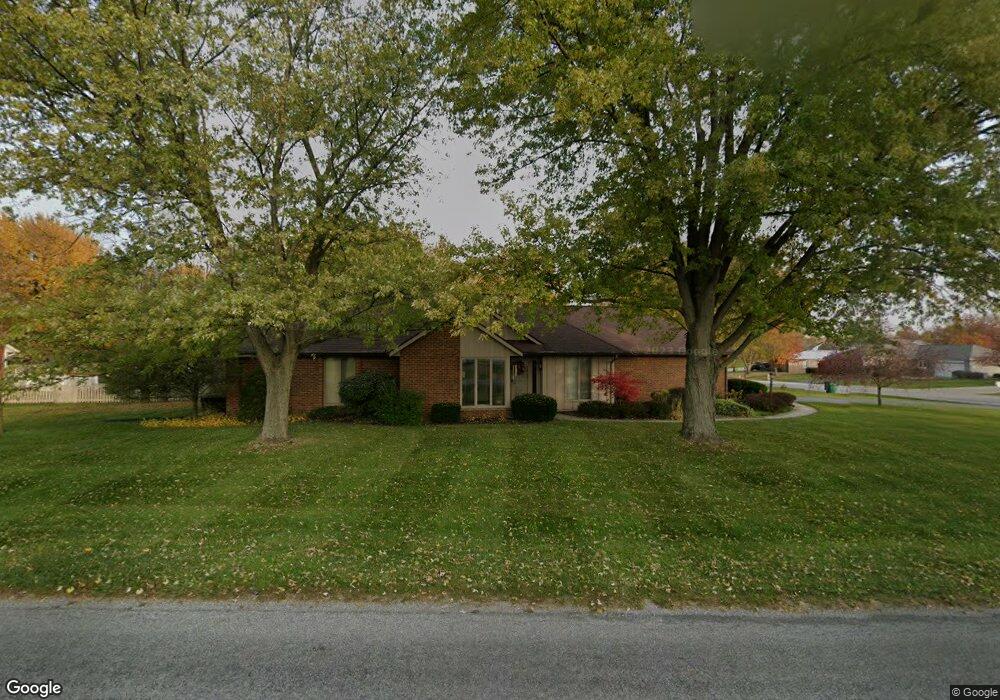
This home is located at 5246 Shoshone Trail, Lima, OH 45805 and is currently estimated at $304,352, approximately $180 per square foot. 5246 Shoshone Trail is a home located in Allen County with nearby schools including Maplewood Elementary School, Elmwood Elementary School, and Shawnee Middle School.
Ownership History
Date
Name
Owned For
Owner Type
Purchase Details
Closed on
Oct 3, 2019
Sold by
Gahman Denise and Estate Of Clayton Cooper Davis
Bought by
Cook Kenneth C and Cook Jenny L
Current Estimated Value
Home Financials for this Owner
Home Financials are based on the most recent Mortgage that was taken out on this home.
Original Mortgage
$188,522
Outstanding Balance
$163,422
Interest Rate
3%
Mortgage Type
FHA
Estimated Equity
$140,930
Purchase Details
Closed on
Jun 26, 1996
Sold by
Connell Timothy
Bought by
Davis Clayton and Davis Shirley
Home Financials for this Owner
Home Financials are based on the most recent Mortgage that was taken out on this home.
Original Mortgage
$75,000
Interest Rate
8.13%
Mortgage Type
New Conventional
Purchase Details
Closed on
Jul 9, 1986
Bought by
Connell Timothy W
Create a Home Valuation Report for This Property
The Home Valuation Report is an in-depth analysis detailing your home's value as well as a comparison with similar homes in the area
Purchase History
| Date | Buyer | Sale Price | Title Company |
|---|---|---|---|
| Cook Kenneth C | $192,000 | None Available | |
| Davis Clayton | $115,500 | -- | |
| Connell Timothy W | $86,500 | -- |
Source: Public Records
Mortgage History
| Date | Status | Borrower | Loan Amount |
|---|---|---|---|
| Open | Cook Kenneth C | $188,522 | |
| Closed | Davis Clayton | $75,000 |
Source: Public Records
Tax History
| Year | Tax Paid | Tax Assessment Tax Assessment Total Assessment is a certain percentage of the fair market value that is determined by local assessors to be the total taxable value of land and additions on the property. | Land | Improvement |
|---|---|---|---|---|
| 2024 | $4,444 | $77,000 | $12,390 | $64,610 |
| 2023 | $4,224 | $63,110 | $10,150 | $52,960 |
| 2022 | $3,696 | $63,110 | $10,150 | $52,960 |
| 2021 | $4,047 | $63,110 | $10,150 | $52,960 |
| 2020 | $2,048 | $50,260 | $9,730 | $40,530 |
| 2019 | $2,048 | $50,260 | $9,730 | $40,530 |
| 2018 | $2,025 | $50,260 | $9,730 | $40,530 |
| 2017 | $2,009 | $48,340 | $9,730 | $38,610 |
| 2016 | $1,948 | $48,340 | $9,730 | $38,610 |
| 2015 | $1,730 | $48,340 | $9,730 | $38,610 |
| 2014 | $1,730 | $43,470 | $8,960 | $34,510 |
| 2013 | $1,697 | $43,470 | $8,960 | $34,510 |
Source: Public Records
Map
Nearby Homes
- 845 Atalan Trail
- 4906 Shoshone Trail
- 4875 Wenatchi Trail
- 616 Wildbrook Ln
- 1602 Wonderlick Rd
- 2340 S Wapak Rd
- 123 Eagles Point W
- 000 N Stevick Rd
- 0000 N Stevick Rd
- 3360 Springview Dr
- 206 Eagles Point St E
- 3390 Spencerville Rd
- 1540 Adak Ave
- 0 Springview Dr
- 2970 Sands Rd
- 0 Agerter Rd
- 4211 Fort Amanda Rd
- 3953 Willow Oak Trail
- 1453 W Shore Dr
- 2940 Koop Rd
- 911 S Wapakoneta Rd
- 5210 Shoshone Trail
- 5249 Shoshone Trail
- 880 Algonkin Trail
- 5217 Shoshone Trail
- 112 Tolowa Trail
- 868 Algonkin Trail
- 1001 S Wapakoneta Rd
- 1001 S Wapak Rd
- 5195 Shoshone Tl
- 846 Algonkin Trail
- 101 Tolowa Trail
- 873 Algonkin Trail
- 822 Algonkin Trail
- 1035 S Wapakoneta Rd
- 5177 Shoshone Trail
Your Personal Tour Guide
Ask me questions while you tour the home.