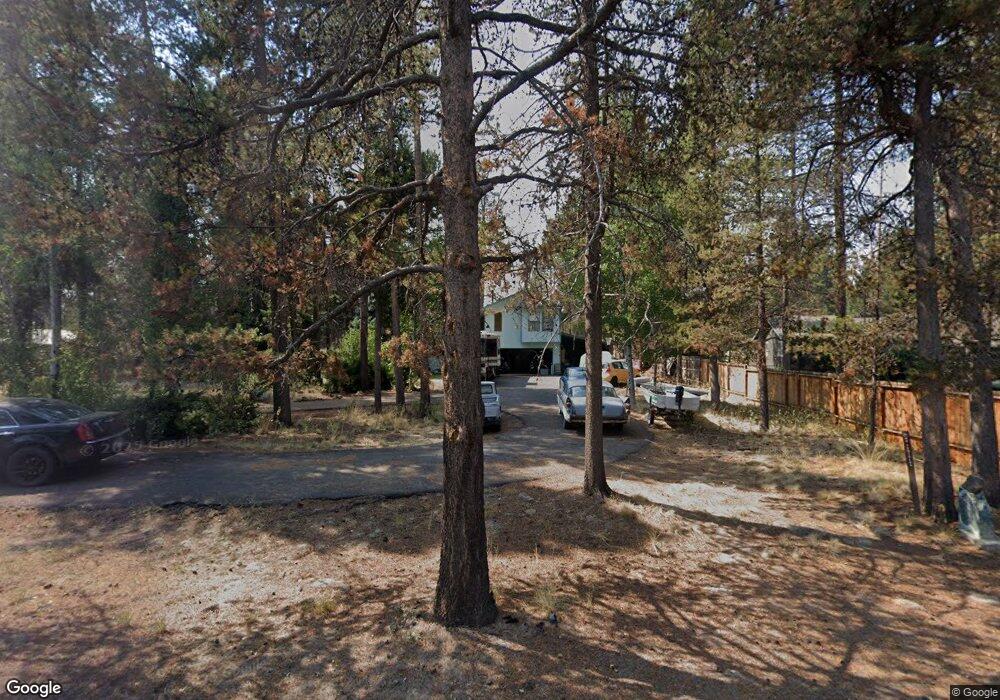
52465 River Pine Rd La Pine, OR 97739
Estimated Value: $466,516 - $537,000
3
Beds
2
Baths
1,934
Sq Ft
$262/Sq Ft
Est. Value
About This Home
This home is located at 52465 River Pine Rd, La Pine, OR 97739 and is currently estimated at $506,879, approximately $262 per square foot. 52465 River Pine Rd is a home located in Deschutes County with nearby schools including La Pine Elementary School, La Pine Middle School, and La Pine Senior High School.
Ownership History
Date
Name
Owned For
Owner Type
Purchase Details
Closed on
Mar 17, 2014
Sold by
Hausman Crystal Kaeleen
Bought by
Hausman Paul Michael
Current Estimated Value
Purchase Details
Closed on
Mar 16, 2006
Sold by
Hausman Paul Michael and Hausman Crystal Kaeleen
Bought by
Hausman Paul M and Hausman Crystal K
Home Financials for this Owner
Home Financials are based on the most recent Mortgage that was taken out on this home.
Original Mortgage
$238,500
Outstanding Balance
$136,955
Interest Rate
6.54%
Mortgage Type
Fannie Mae Freddie Mac
Estimated Equity
$369,924
Purchase Details
Closed on
Dec 22, 2003
Sold by
Conner Colleen M
Bought by
Hausman Paul Michael and Hausman Crystal Kaeleen
Home Financials for this Owner
Home Financials are based on the most recent Mortgage that was taken out on this home.
Original Mortgage
$114,750
Interest Rate
5.62%
Mortgage Type
Unknown
Create a Home Valuation Report for This Property
The Home Valuation Report is an in-depth analysis detailing your home's value as well as a comparison with similar homes in the area
Home Values in the Area
Average Home Value in this Area
Purchase History
| Date | Buyer | Sale Price | Title Company |
|---|---|---|---|
| Hausman Paul Michael | -- | None Available | |
| Hausman Paul M | -- | Amerititle | |
| Hausman Paul Michael | $153,000 | Western Title & Escrow Co |
Source: Public Records
Mortgage History
| Date | Status | Borrower | Loan Amount |
|---|---|---|---|
| Open | Hausman Paul M | $238,500 | |
| Closed | Hausman Paul Michael | $114,750 | |
| Closed | Hausman Paul Michael | $38,250 |
Source: Public Records
Tax History
| Year | Tax Paid | Tax Assessment Tax Assessment Total Assessment is a certain percentage of the fair market value that is determined by local assessors to be the total taxable value of land and additions on the property. | Land | Improvement |
|---|---|---|---|---|
| 2025 | $3,330 | $202,320 | -- | -- |
| 2024 | $3,192 | $196,430 | -- | -- |
| 2023 | $3,122 | $190,710 | $0 | $0 |
| 2022 | $2,773 | $179,770 | $0 | $0 |
| 2021 | $2,791 | $174,540 | $0 | $0 |
| 2020 | $2,644 | $174,540 | $0 | $0 |
| 2019 | $2,571 | $169,460 | $0 | $0 |
| 2018 | $2,498 | $164,530 | $0 | $0 |
| 2017 | $2,433 | $159,740 | $0 | $0 |
| 2016 | $2,319 | $155,090 | $0 | $0 |
| 2015 | $2,210 | $150,580 | $0 | $0 |
| 2014 | $2,062 | $142,390 | $0 | $0 |
Source: Public Records
Map
Nearby Homes
- 52466 Lost Ponderosa Rd
- 52495 Lost Ponderosa Rd
- 52356 Allen Dr
- 52327 Allen Dr Unit 5
- 16650 Willow Ln
- 16255 Paulina View Rd
- 52255 Huntington Rd
- 52485 Huntington Rd
- 52555 Pine Dr
- 16120 Burgess Rd
- 16760 Pine Place
- 52494 Deerfield Dr
- 52505 Deer Field Dr
- 16065 Cascade Ln
- 52842 Bridge Dr
- 16034 Cascade Ln
- 52844 Timber Lane Loop
- 16015 Sunset Ln
- 52459 Medill Ct
- 52195 Elderberry Ln
- 52475 River Pine Rd
- 52455 River Pine Rd
- 52485 River Pine Rd
- 52445 River Pine Rd
- 52592 River Pine Rd
- 52464 River Pine Rd Unit A
- 52464 River Pine Rd
- 52474 River Pine
- 52474 River Pine Rd
- 52493 River Pine Rd
- 52435 River Pine Rd
- 52484 River Pine Rd
- 52492 River Pine Rd
- 52430 River Pine Rd
- 52503 River Pine Rd
- 52436 River Pine Rd
- 52476 Lost Ponderosa Rd
- 52484 Lost Ponderosa Rd
- 52427 River Pine Rd
- 52494 Lost Ponderosa Rd
Your Personal Tour Guide
Ask me questions while you tour the home.