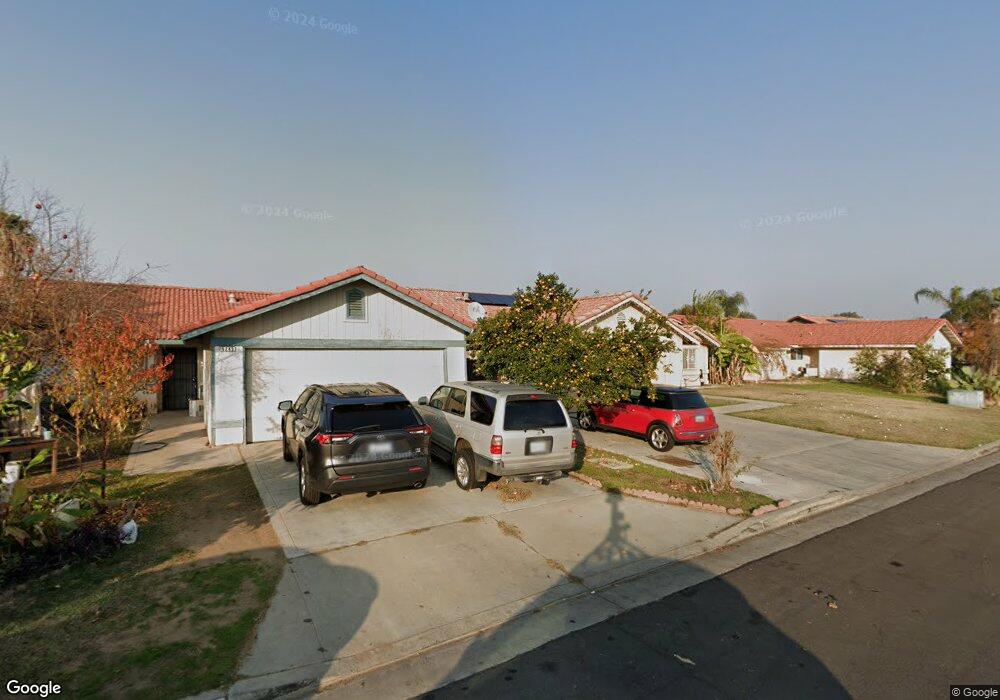
5247 E Hedges Ave Fresno, CA 93727
Roosevelt NeighborhoodEstimated Value: $350,197 - $433,000
4
Beds
2
Baths
1,553
Sq Ft
$243/Sq Ft
Est. Value
About This Home
This home is located at 5247 E Hedges Ave, Fresno, CA 93727 and is currently estimated at $378,066, approximately $243 per square foot. 5247 E Hedges Ave is a home located in Fresno County with nearby schools including Turner Elementary School, Scandinavian Middle School, and Mclane High School.
Ownership History
Date
Name
Owned For
Owner Type
Purchase Details
Closed on
Apr 20, 2000
Sold by
Hud
Bought by
Inthavong Jaroon and Inthavong Sengchan
Current Estimated Value
Home Financials for this Owner
Home Financials are based on the most recent Mortgage that was taken out on this home.
Original Mortgage
$84,305
Outstanding Balance
$28,903
Interest Rate
8.24%
Mortgage Type
FHA
Estimated Equity
$349,163
Purchase Details
Closed on
Dec 16, 1999
Sold by
California Housing Finance Agency
Bought by
Hud
Purchase Details
Closed on
Dec 7, 1999
Sold by
Sok Nhem Sokhan and Kang Kotsakin
Bought by
California Housing Finance Agency
Purchase Details
Closed on
Dec 9, 1994
Sold by
Olive Branch Estates
Bought by
Nhem Sokhan Sok and Kang Kotsakin
Home Financials for this Owner
Home Financials are based on the most recent Mortgage that was taken out on this home.
Original Mortgage
$103,477
Interest Rate
9.08%
Mortgage Type
FHA
Create a Home Valuation Report for This Property
The Home Valuation Report is an in-depth analysis detailing your home's value as well as a comparison with similar homes in the area
Home Values in the Area
Average Home Value in this Area
Purchase History
| Date | Buyer | Sale Price | Title Company |
|---|---|---|---|
| Inthavong Jaroon | $85,500 | North American Title Co | |
| Hud | -- | First American Title Ins Co | |
| California Housing Finance Agency | $109,310 | American Title | |
| Nhem Sokhan Sok | $104,500 | Central Title Company |
Source: Public Records
Mortgage History
| Date | Status | Borrower | Loan Amount |
|---|---|---|---|
| Open | Inthavong Jaroon | $84,305 | |
| Previous Owner | Nhem Sokhan Sok | $103,477 |
Source: Public Records
Tax History
| Year | Tax Paid | Tax Assessment Tax Assessment Total Assessment is a certain percentage of the fair market value that is determined by local assessors to be the total taxable value of land and additions on the property. | Land | Improvement |
|---|---|---|---|---|
| 2025 | $1,689 | $130,618 | $38,413 | $92,205 |
| 2023 | $1,594 | $125,548 | $36,922 | $88,626 |
| 2022 | $1,572 | $123,088 | $36,199 | $86,889 |
| 2021 | $1,529 | $120,676 | $35,490 | $85,186 |
| 2020 | $1,522 | $119,440 | $35,127 | $84,313 |
| 2019 | $1,465 | $117,099 | $34,439 | $82,660 |
| 2018 | $1,433 | $114,804 | $33,764 | $81,040 |
| 2017 | $1,408 | $112,553 | $33,102 | $79,451 |
| 2016 | $1,362 | $110,347 | $32,453 | $77,894 |
| 2015 | $1,342 | $108,690 | $31,966 | $76,724 |
| 2014 | $1,314 | $106,562 | $31,340 | $75,222 |
Source: Public Records
Map
Nearby Homes
- 1221 N Peach Ave Unit 142
- 1221 N Peach Ave Unit 101
- 5180 E Hedges Ave
- 5181 E Olive Ave Unit 117
- 5181 E Olive Ave Unit 113
- 1223 N Sylmar Ave
- 6567 E Pine Ave
- 5097 E Carmen Ave
- 5036 E Sooner Dr
- 5225 E Belmont Ave
- 1353 N Adler Ave
- 5009 E Clay Ave
- 5011 E Harvey Ave
- 5468 E Grant Ave
- 4984 E Belmont Ave
- 4873 E Pine Ave
- 225 N Sylmar Ave
- 5576 E Belmont Ave
- 5545 E Washington Ave
- 1745 N Winery Ave Unit 102
- 5251 E Hedges Ave
- 5243 E Hedges Ave
- 5250 E Huffman Ave
- 5244 E Huffman Ave
- 5237 E Hedges Ave
- 5257 E Hedges Ave
- 5354 E Huffman Ave
- 5238 E Huffman Ave
- 5248 E Hedges Ave
- 5360 E Huffman Ave
- 5234 E Huffman Ave
- 5244 E Hedges Ave
- 5252 E Hedges Ave
- 5261 E Hedges Ave
- 5233 E Hedges Ave
- 5238 E Hedges Ave
- 5258 E Hedges Ave
- 5366 E Huffman Ave
- 5230 E Huffman Ave
- 5262 E Hedges Ave
Your Personal Tour Guide
Ask me questions while you tour the home.