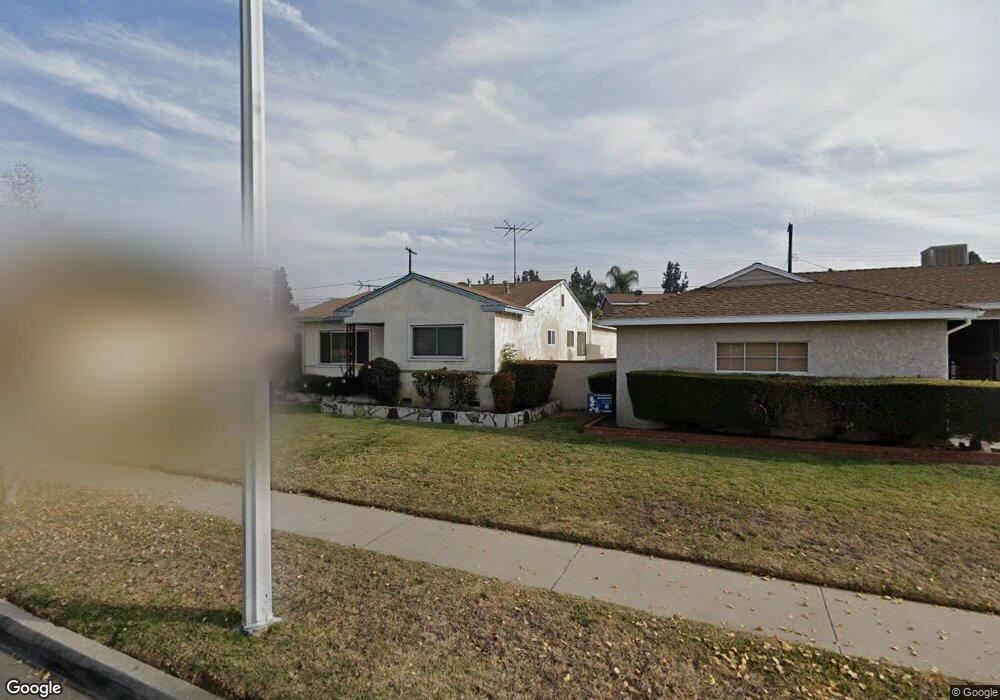
5248 Los Toros Ave Pico Rivera, CA 90660
Estimated Value: $783,000 - $846,000
3
Beds
2
Baths
1,925
Sq Ft
$428/Sq Ft
Est. Value
About This Home
This home is located at 5248 Los Toros Ave, Pico Rivera, CA 90660 and is currently estimated at $824,269, approximately $428 per square foot. 5248 Los Toros Ave is a home located in Los Angeles County with nearby schools including Rio Vista Elementary School, Ruben Salazar Continuation School, and El Rancho High School.
Ownership History
Date
Name
Owned For
Owner Type
Purchase Details
Closed on
Mar 8, 2016
Sold by
Medina Rosa I
Bought by
Gonzales John W
Current Estimated Value
Purchase Details
Closed on
Nov 26, 2002
Sold by
Gonzales John W and Gonzales Olga
Bought by
Gonzales John W and Medina Rosa I
Home Financials for this Owner
Home Financials are based on the most recent Mortgage that was taken out on this home.
Original Mortgage
$201,300
Interest Rate
6.5%
Purchase Details
Closed on
Feb 16, 1999
Sold by
Muro Louis E and Muro Frances G
Bought by
Gonzales John W and Gonzales Olga
Home Financials for this Owner
Home Financials are based on the most recent Mortgage that was taken out on this home.
Original Mortgage
$183,770
Interest Rate
7.04%
Mortgage Type
FHA
Create a Home Valuation Report for This Property
The Home Valuation Report is an in-depth analysis detailing your home's value as well as a comparison with similar homes in the area
Home Values in the Area
Average Home Value in this Area
Purchase History
| Date | Buyer | Sale Price | Title Company |
|---|---|---|---|
| Gonzales John W | -- | None Available | |
| Gonzales John W | -- | Investors Title Company | |
| Gonzales John W | $185,000 | Southland Title Corporation |
Source: Public Records
Mortgage History
| Date | Status | Borrower | Loan Amount |
|---|---|---|---|
| Previous Owner | Gonzales John W | $201,300 | |
| Previous Owner | Gonzales John W | $183,770 |
Source: Public Records
Tax History Compared to Growth
Tax History
| Year | Tax Paid | Tax Assessment Tax Assessment Total Assessment is a certain percentage of the fair market value that is determined by local assessors to be the total taxable value of land and additions on the property. | Land | Improvement |
|---|---|---|---|---|
| 2025 | $5,105 | $339,791 | $204,865 | $134,926 |
| 2024 | $5,105 | $333,130 | $200,849 | $132,281 |
| 2023 | $4,969 | $326,599 | $196,911 | $129,688 |
| 2022 | $4,751 | $320,196 | $193,050 | $127,146 |
| 2021 | $4,629 | $313,918 | $189,265 | $124,653 |
| 2019 | $4,600 | $304,608 | $183,652 | $120,956 |
| 2018 | $4,316 | $298,636 | $180,051 | $118,585 |
| 2016 | $3,894 | $287,041 | $173,060 | $113,981 |
| 2015 | $3,837 | $282,730 | $170,461 | $112,269 |
| 2014 | $3,792 | $277,192 | $167,122 | $110,070 |
Source: Public Records
Map
Nearby Homes
- 5442 Zola Ave
- 8803 Dunlap Crossing Rd
- 5101 Lindsey Ave
- 4918 Rosemead Blvd
- 5328 Lemoran Ave
- 9140 Rosehedge Dr
- 4707 Rosemead Blvd
- 8630 Elba St
- 9324 Via Azul
- 9326 Via Azul
- 9331 Via Azul
- 9328 Via Azul
- 4947 Tobias Ave
- Plan 1560 at Azul
- Plan 1680 at Azul
- Plan 1706 Modeled at Azul
- 9339 Via Azul
- 9530 Underwood St
- 9335 Via Azul
- 4753 Orange St
- 5252 Los Toros Ave
- 5242 Los Toros Ave
- 5333 Zola Ave
- 5258 Los Toros Ave
- 5327 Zola Ave
- 5339 Zola Ave
- 5236 Los Toros Ave
- 5323 Zola Ave
- 5347 Zola Ave
- 5245 Los Toros Ave
- 5262 Los Toros Ave
- 5253 Los Toros Ave
- 5355 Zola Ave
- 5230 Los Toros Ave
- 5317 Zola Ave
- 5239 Los Toros Ave
- 5259 Los Toros Ave
- 5361 Zola Ave
- 5268 Los Toros Ave
- 5233 Los Toros Ave