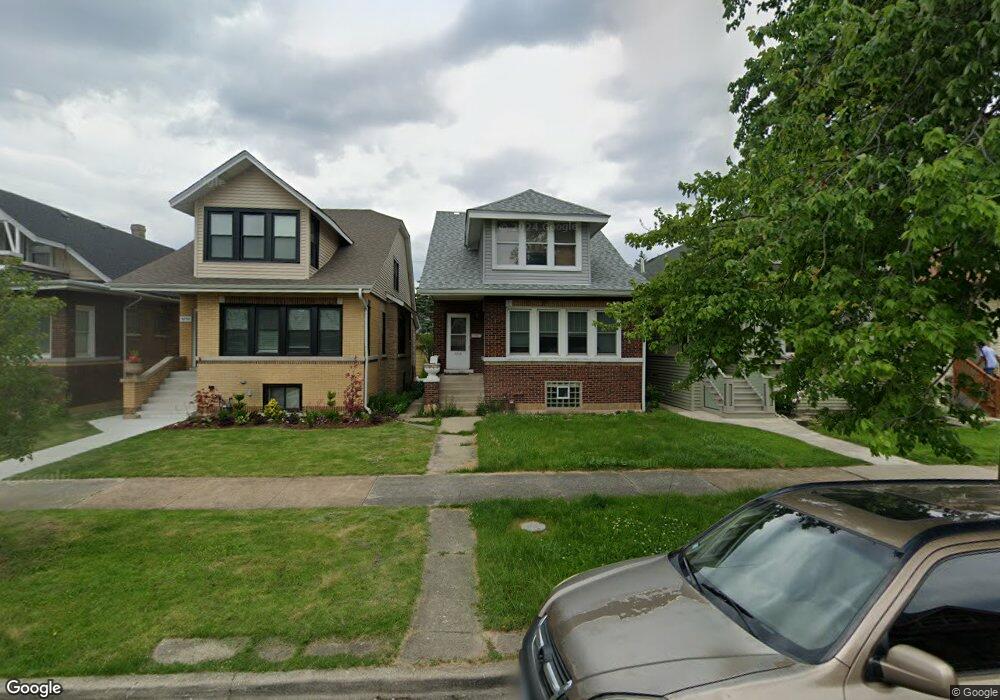
5248 W Warner Ave Chicago, IL 60641
Portage Park NeighborhoodEstimated Value: $421,000 - $554,000
3
Beds
1
Bath
1,743
Sq Ft
$268/Sq Ft
Est. Value
About This Home
This home is located at 5248 W Warner Ave, Chicago, IL 60641 and is currently estimated at $466,615, approximately $267 per square foot. 5248 W Warner Ave is a home located in Cook County with nearby schools including Portage Park Elementary School, Schurz High School, and St John Lutheran School.
Ownership History
Date
Name
Owned For
Owner Type
Purchase Details
Closed on
Jul 9, 2009
Sold by
Weissner David
Bought by
Weissner Jennifer
Current Estimated Value
Purchase Details
Closed on
Aug 27, 1999
Sold by
Meneses Dolores and Meneses Miguel
Bought by
Weissner David E and Weissner Jennifer C
Home Financials for this Owner
Home Financials are based on the most recent Mortgage that was taken out on this home.
Original Mortgage
$185,250
Interest Rate
7.72%
Purchase Details
Closed on
Dec 27, 1994
Sold by
Prado Ofelia and Meneses Dolores
Bought by
Prado Ofelia and Meneses Dolores
Home Financials for this Owner
Home Financials are based on the most recent Mortgage that was taken out on this home.
Original Mortgage
$148,160
Interest Rate
8.91%
Mortgage Type
FHA
Purchase Details
Closed on
Nov 2, 1994
Sold by
Sit Barbara and Sit Jacek
Bought by
Serrano Jose and Prado Ofelia
Home Financials for this Owner
Home Financials are based on the most recent Mortgage that was taken out on this home.
Original Mortgage
$148,160
Interest Rate
8.91%
Mortgage Type
FHA
Create a Home Valuation Report for This Property
The Home Valuation Report is an in-depth analysis detailing your home's value as well as a comparison with similar homes in the area
Home Values in the Area
Average Home Value in this Area
Purchase History
| Date | Buyer | Sale Price | Title Company |
|---|---|---|---|
| Weissner Jennifer | -- | None Available | |
| Weissner David E | $195,000 | Chicago Title Insurance Co | |
| Prado Ofelia | -- | -- | |
| Serrano Jose | $150,000 | -- |
Source: Public Records
Mortgage History
| Date | Status | Borrower | Loan Amount |
|---|---|---|---|
| Previous Owner | Weissner David E | $185,250 | |
| Previous Owner | Serrano Jose | $148,160 |
Source: Public Records
Tax History Compared to Growth
Tax History
| Year | Tax Paid | Tax Assessment Tax Assessment Total Assessment is a certain percentage of the fair market value that is determined by local assessors to be the total taxable value of land and additions on the property. | Land | Improvement |
|---|---|---|---|---|
| 2024 | $6,685 | $43,000 | $13,125 | $29,875 |
| 2023 | $6,495 | $35,000 | $10,500 | $24,500 |
| 2022 | $6,495 | $35,000 | $10,500 | $24,500 |
| 2021 | $6,369 | $35,000 | $10,500 | $24,500 |
| 2020 | $5,949 | $29,807 | $5,437 | $24,370 |
| 2019 | $5,965 | $33,119 | $5,437 | $27,682 |
| 2018 | $5,864 | $33,119 | $5,437 | $27,682 |
| 2017 | $5,385 | $28,392 | $4,875 | $23,517 |
| 2016 | $5,186 | $28,392 | $4,875 | $23,517 |
| 2015 | $4,722 | $28,392 | $4,875 | $23,517 |
| 2014 | $4,847 | $28,695 | $4,500 | $24,195 |
| 2013 | $4,741 | $28,695 | $4,500 | $24,195 |
Source: Public Records
Map
Nearby Homes
- 5213 W Warner Ave
- 5255 W Belle Plaine Ave
- 5253 W Cullom Ave
- 4119 N Leclaire Ave
- 5410 W Hutchinson St
- 5221 W Montrose Ave
- 5141 W Dakin St
- 5401 W Montrose Ave
- 5354 W Montrose Ave
- 5436 W Dakin St
- 5036 W Pensacola Ave Unit 309
- 5062 W Agatite Ave Unit 3
- 5043 W Sunnyside Ave
- 5501 W Byron St
- 4848 W Belle Plaine Ave Unit 2R
- 5352 W Sunnyside Ave
- 4904 W Byron St
- 4855 W Montrose Ave
- 5330 W Windsor Ave Unit 3I
- 4501 N Lavergne Ave
- 5250 W Warner Ave
- 5246 W Warner Ave
- 5242 W Warner Ave
- 5252 W Warner Ave
- 5240 W Warner Ave
- 5256 W Warner Ave
- 5236 W Warner Ave
- 5247 W Berteau Ave
- 5253 W Berteau Ave
- 5232 W Warner Ave
- 5243 W Berteau Ave
- 5255 W Berteau Ave
- 5241 W Berteau Ave
- 5257 W Berteau Ave
- 5230 W Warner Ave
- 5247 W Warner Ave
- 5237 W Berteau Ave
- 5300 W Warner Ave
- 5249 W Warner Ave Unit 1
- 5249 W Warner Ave