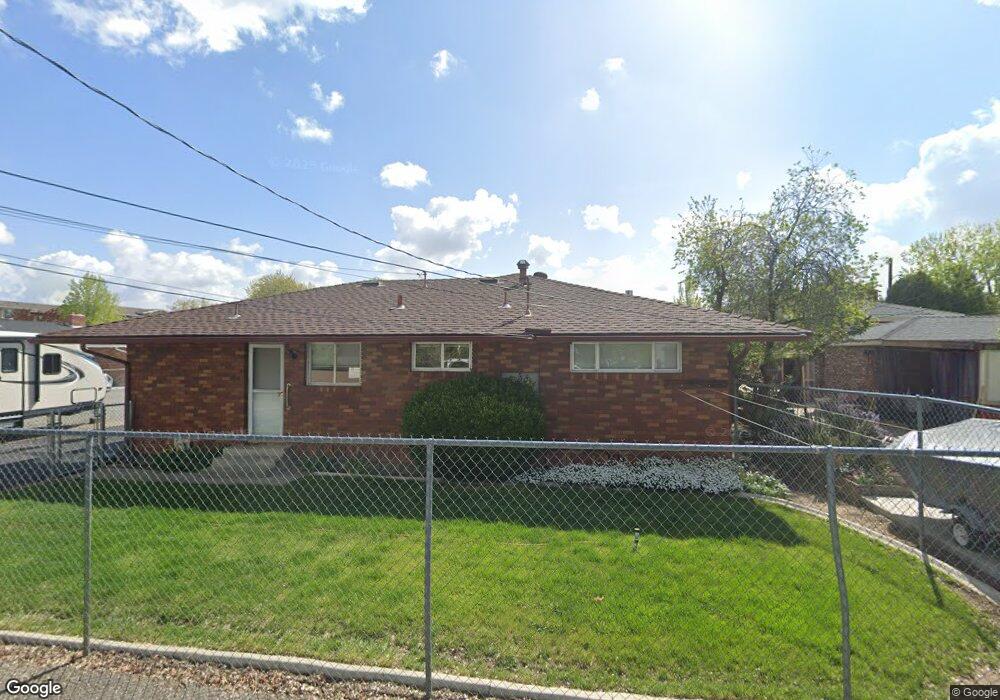
525 4th St Sparks, NV 89431
Downtown Sparks NeighborhoodEstimated Value: $454,319 - $607,000
4
Beds
2
Baths
1,803
Sq Ft
$288/Sq Ft
Est. Value
About This Home
This home is located at 525 4th St, Sparks, NV 89431 and is currently estimated at $519,080, approximately $287 per square foot. 525 4th St is a home located in Washoe County with nearby schools including Lincoln Park Elementary School, George L Dilworth Middle School, and Sparks High School.
Ownership History
Date
Name
Owned For
Owner Type
Purchase Details
Closed on
Feb 10, 2015
Sold by
Franchi David L
Bought by
Franchi David L
Current Estimated Value
Purchase Details
Closed on
Aug 8, 2001
Sold by
Franchi Irene
Bought by
Franchi Irene and The Irene Franchi Trust
Create a Home Valuation Report for This Property
The Home Valuation Report is an in-depth analysis detailing your home's value as well as a comparison with similar homes in the area
Home Values in the Area
Average Home Value in this Area
Purchase History
| Date | Buyer | Sale Price | Title Company |
|---|---|---|---|
| Franchi David L | -- | None Available | |
| Franchi Irene | -- | -- |
Source: Public Records
Tax History Compared to Growth
Tax History
| Year | Tax Paid | Tax Assessment Tax Assessment Total Assessment is a certain percentage of the fair market value that is determined by local assessors to be the total taxable value of land and additions on the property. | Land | Improvement |
|---|---|---|---|---|
| 2025 | $1,001 | $68,578 | $43,806 | $24,772 |
| 2024 | $1,001 | $65,324 | $40,646 | $24,679 |
| 2023 | $972 | $62,560 | $41,270 | $21,290 |
| 2022 | $944 | $52,480 | $34,508 | $17,971 |
| 2021 | $914 | $44,242 | $26,644 | $17,598 |
| 2020 | $886 | $44,908 | $27,563 | $17,345 |
| 2019 | $844 | $40,350 | $23,594 | $16,756 |
| 2018 | $819 | $31,937 | $15,950 | $15,987 |
| 2017 | $797 | $30,270 | $14,700 | $15,570 |
| 2016 | $777 | $27,407 | $11,760 | $15,647 |
| 2015 | $775 | $24,171 | $8,453 | $15,718 |
| 2014 | $752 | $22,092 | $7,350 | $14,742 |
| 2013 | -- | $20,089 | $6,468 | $13,621 |
Source: Public Records
Map
Nearby Homes
- 400 4th St
- 402 5th St
- 10 Lincoln Way
- 324 Victorian Ave
- 512 Victorian Ave
- 345 H St
- 621 9th St
- 3 Strobel Way
- 300 I St
- 829 10th St
- 985 10th St
- 360 E Lincoln Way
- 445 Pine Meadows Dr Unit E25
- 560 Nichols Blvd
- 1010 12th St
- 601 Oakwood Dr Unit 4
- 611 Oakwood Dr Unit 1
- 604 Oakwood Dr Unit 1
- 644 Oakwood Dr Unit 2
- 385 Gleeson Way