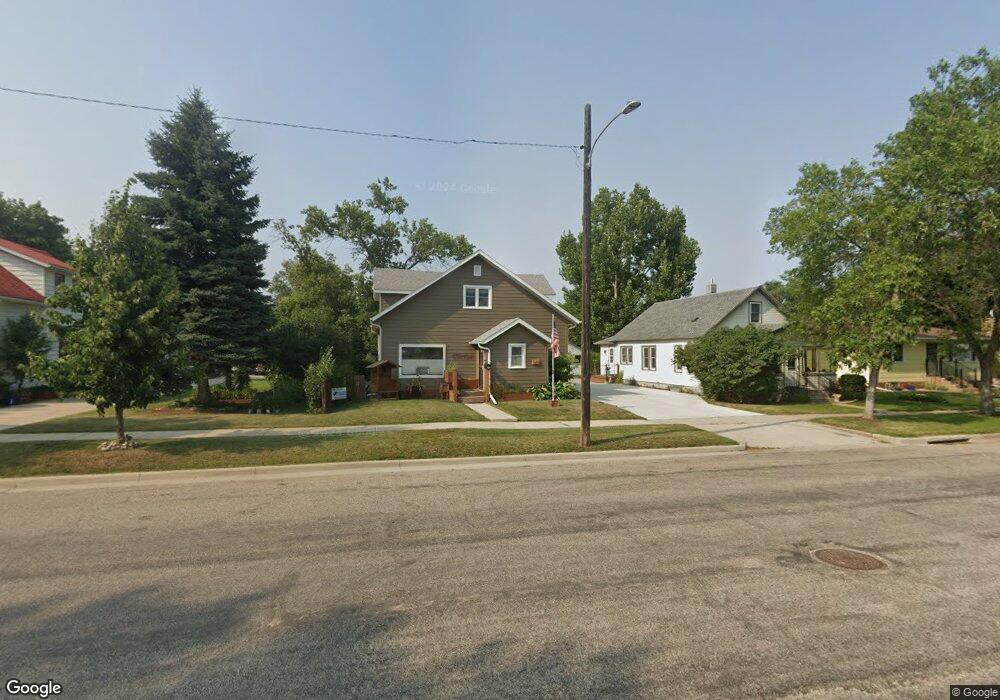
525 5th St SE Jamestown, ND 58401
Estimated Value: $232,000 - $291,000
5
Beds
3
Baths
2,884
Sq Ft
$88/Sq Ft
Est. Value
About This Home
This home is located at 525 5th St SE, Jamestown, ND 58401 and is currently estimated at $252,410, approximately $87 per square foot. 525 5th St SE is a home located in Stutsman County with nearby schools including Jamestown High School, St. John's Academy, and Our Saviors Lutheran E.
Ownership History
Date
Name
Owned For
Owner Type
Purchase Details
Closed on
Apr 17, 2019
Sold by
Secretary Of Housing & Urban Development
Bought by
Bayer Corey and Bayer Jodi
Current Estimated Value
Purchase Details
Closed on
Aug 28, 2018
Sold by
Albrecht Cheri L
Bought by
Ocwen Loan Servicing Llc
Purchase Details
Closed on
Aug 23, 2018
Sold by
Ocwen Loan Servicing Llc
Bought by
Secretary Of Housing & Urban Development
Purchase Details
Closed on
Jun 14, 2018
Sold by
Albrecht Cheri L
Bought by
Oewen Loan Servicing Llc
Purchase Details
Closed on
Nov 20, 2009
Sold by
Donegan Francis J
Bought by
Albrecht Cheri L
Home Financials for this Owner
Home Financials are based on the most recent Mortgage that was taken out on this home.
Original Mortgage
$77,569
Interest Rate
4.9%
Mortgage Type
FHA
Create a Home Valuation Report for This Property
The Home Valuation Report is an in-depth analysis detailing your home's value as well as a comparison with similar homes in the area
Home Values in the Area
Average Home Value in this Area
Purchase History
| Date | Buyer | Sale Price | Title Company |
|---|---|---|---|
| Bayer Corey | -- | None Available | |
| Ocwen Loan Servicing Llc | $59,213 | None Available | |
| Secretary Of Housing & Urban Development | -- | Servicelink | |
| Oewen Loan Servicing Llc | $59,213 | None Available | |
| Albrecht Cheri L | $79,000 | None Available |
Source: Public Records
Mortgage History
| Date | Status | Borrower | Loan Amount |
|---|---|---|---|
| Previous Owner | Albrecht Cheri L | $77,569 |
Source: Public Records
Tax History
| Year | Tax Paid | Tax Assessment Tax Assessment Total Assessment is a certain percentage of the fair market value that is determined by local assessors to be the total taxable value of land and additions on the property. | Land | Improvement |
|---|---|---|---|---|
| 2025 | $2,674 | $132,450 | $4,750 | $127,700 |
| 2024 | $40 | $130,050 | $4,750 | $125,300 |
| 2023 | $4,238 | $128,350 | $4,750 | $123,600 |
| 2022 | $2,216 | $59,813 | $5,138 | $54,675 |
| 2021 | $2,148 | $56,784 | $4,940 | $51,844 |
| 2020 | $2,106 | $55,952 | $4,940 | $51,012 |
| 2019 | $2,116 | $55,172 | $4,940 | $50,232 |
| 2018 | $2,165 | $53,092 | $0 | $0 |
| 2017 | $1,993 | $52,676 | $0 | $0 |
| 2016 | $1,681 | $55,262 | $0 | $0 |
| 2013 | -- | $3,708 | $338 | $3,371 |
Source: Public Records
Map
Nearby Homes
- 519 4th St SE
- 722 4th Ave SE
- 120 4th Ave SE
- 514 2nd Ave SE
- 924 3rd Ave SE
- Tbd 2nd St SE
- 1201 2nd Ave SW
- 310 11th Ave NE
- 220 4th Ave SW
- 1337 2nd St SE
- 406 1st Ave N
- 1101 3rd St NE
- 328 12th Ave NE
- 614 14th St SE
- 332 12th Ave NE
- 243 14th Ave NE
- 609 15th St SE
- Tbd Highway 281
- 443 1st St W
- 320 5th Ave SW
Your Personal Tour Guide
Ask me questions while you tour the home.